| G | PA | Actual PA | AB | R | H | 1B | 2B | 3B | HR | IHR | OHR | RBI | BB | RBB | ABB | Kc | Ks | SO | SF | RPA | OBP | ROBP | SLG | OPS | ROPS | AVG | ROE | FC | CI | GDP | GTP | AB/RSP | H/RSP | BA/RSP |
|---|---|---|---|---|---|---|---|---|---|---|---|---|---|---|---|---|---|---|---|---|---|---|---|---|---|---|---|---|---|---|---|---|---|---|
| 13 | 44 | 42 | 41 | 21 | 27 | 23 | 1 | 1 | 2 | 2 | 0 | 19 | 3 | 1 | 2 | 0 | 1 | 1 | 0 | 0.864 | 0.682 | 0.667 | 0.878 | 1.560 | 1.545 | 0.659 | 0 | 6 | 0 | 0 | 0 | 29 | 18 | 0.621 |
| PA | 1B | 2B | 3B | IHR | OHR | ABB | RBB | Kc | Ks | SF | ROE | FC | GDP | GTP | Other |
|---|---|---|---|---|---|---|---|---|---|---|---|---|---|---|---|
| 44 | 52.3% | 2.3% | 2.3% | 4.5% | 0.0% | 4.5% | 2.3% | 0.0% | 2.3% | 0.0% | 0.0% | 13.6% | 0.0% | 0.0% | 15.9% |
| Actual PA | 1B | 2B | 3B | IHR | OHR | RBB | Kc | Ks | SF | ROE | FC | GDP | GTP | Other |
|---|---|---|---|---|---|---|---|---|---|---|---|---|---|---|
| 42 | 54.8% | 2.4% | 2.4% | 4.8% | 0.0% | 2.4% | 0.0% | 2.4% | 0.0% | 0.0% | 14.3% | 0.0% | 0.0% | 16.7% |
| YEAR | G | PA | Actual PA | AB | R | H | 1B | 2B | 3B | HR | IHR | OHR | RBI | BB | RBB | ABB | Kc | Ks | SO | SF | RPA | OBP | ROBP | SLG | OPS | ROPS | AVG | ROE | FC | CI | GDP | GTP | AB/RSP | H/RSP | BA/RSP |
|---|---|---|---|---|---|---|---|---|---|---|---|---|---|---|---|---|---|---|---|---|---|---|---|---|---|---|---|---|---|---|---|---|---|---|---|
| 2010 | 4 | 12 | 11 | 11 | 4 | 7 | 6 | 0 | 0 | 1 | 1 | 0 | 5 | 1 | 0 | 1 | 0 | 0 | 0 | 0 | 0.667 | 0.667 | 0.636 | 0.909 | 1.576 | 1.545 | 0.636 | 0 | 3 | 0 | 0 | 0 | 9 | 5 | 0.556 |
| 2011 | 5 | 19 | 19 | 19 | 9 | 13 | 12 | 0 | 0 | 1 | 1 | 0 | 8 | 0 | 0 | 0 | 0 | 1 | 1 | 0 | 0.842 | 0.684 | 0.684 | 0.842 | 1.526 | 1.526 | 0.684 | 0 | 2 | 0 | 0 | 0 | 10 | 6 | 0.600 |
| 2012 | 4 | 13 | 12 | 11 | 8 | 7 | 5 | 1 | 1 | 0 | 0 | 0 | 6 | 2 | 1 | 1 | 0 | 0 | 0 | 0 | 1.077 | 0.692 | 0.667 | 0.909 | 1.601 | 1.576 | 0.636 | 0 | 1 | 0 | 0 | 0 | 10 | 7 | 0.700 |
| TOTALS | 13 | 44 | 42 | 41 | 21 | 27 | 23 | 1 | 1 | 2 | 2 | 0 | 19 | 3 | 1 | 2 | 0 | 1 | 1 | 0 | 0.864 | 0.682 | 0.667 | 0.878 | 1.560 | 1.545 | 0.659 | 0 | 6 | 0 | 0 | 0 | 29 | 18 | 0.621 |
| YEAR | PA | 1B | 2B | 3B | IHR | OHR | ABB | RBB | Kc | Ks | SF | ROE | FC | GDP | GTP | Other |
|---|---|---|---|---|---|---|---|---|---|---|---|---|---|---|---|---|
| 2010 | 12 | 50.0% | 0.0% | 0.0% | 8.3% | 0.0% | 8.3% | 0.0% | 0.0% | 0.0% | 0.0% | 0.0% | 25.0% | 0.0% | 0.0% | 8.3% |
| 2011 | 19 | 63.2% | 0.0% | 0.0% | 5.3% | 0.0% | 0.0% | 0.0% | 0.0% | 5.3% | 0.0% | 0.0% | 10.5% | 0.0% | 0.0% | 15.8% |
| 2012 | 13 | 38.5% | 7.7% | 7.7% | 0.0% | 0.0% | 7.7% | 7.7% | 0.0% | 0.0% | 0.0% | 0.0% | 7.7% | 0.0% | 0.0% | 23.1% |
| TOTALS | 44 | 52.3% | 2.3% | 2.3% | 4.5% | 0.0% | 4.5% | 2.3% | 0.0% | 2.3% | 0.0% | 0.0% | 13.6% | 0.0% | 0.0% | 15.9% |
| YEAR | Actual PA | 1B | 2B | 3B | IHR | OHR | RBB | Kc | Ks | SF | ROE | FC | GDP | GTP | Other |
|---|---|---|---|---|---|---|---|---|---|---|---|---|---|---|---|
| 2010 | 11 | 54.5% | 0.0% | 0.0% | 9.1% | 0.0% | 0.0% | 0.0% | 0.0% | 0.0% | 0.0% | 27.3% | 0.0% | 0.0% | 9.1% |
| 2011 | 19 | 63.2% | 0.0% | 0.0% | 5.3% | 0.0% | 0.0% | 0.0% | 5.3% | 0.0% | 0.0% | 10.5% | 0.0% | 0.0% | 15.8% |
| 2012 | 12 | 41.7% | 8.3% | 8.3% | 0.0% | 0.0% | 8.3% | 0.0% | 0.0% | 0.0% | 0.0% | 8.3% | 0.0% | 0.0% | 25.0% |
| TOTALS | 42 | 54.8% | 2.4% | 2.4% | 4.8% | 0.0% | 2.4% | 0.0% | 2.4% | 0.0% | 0.0% | 14.3% | 0.0% | 0.0% | 16.7% |
| # | MONTH | G | PA | Actual PA | AB | R | H | 1B | 2B | 3B | HR | IHR | OHR | RBI | BB | RBB | ABB | Kc | Ks | SO | SF | RPA | OBP | ROBP | SLG | OPS | ROPS | AVG | ROE | FC | CI | GDP | GTP | AB/RSP | H/RSP | BA/RSP |
|---|---|---|---|---|---|---|---|---|---|---|---|---|---|---|---|---|---|---|---|---|---|---|---|---|---|---|---|---|---|---|---|---|---|---|---|---|
| 2 | Feb | 1 | 3 | 2 | 2 | 3 | 2 | 1 | 1 | 0 | 0 | 0 | 0 | 1 | 1 | 0 | 1 | 0 | 0 | 0 | 0 | 1.333 | 1.000 | 1.000 | 1.500 | 2.500 | 2.500 | 1.000 | 0 | 0 | 0 | 0 | 0 | 2 | 2 | 1.000 |
| 3 | Mar | 1 | 4 | 4 | 4 | 3 | 4 | 3 | 0 | 1 | 0 | 0 | 0 | 3 | 0 | 0 | 0 | 0 | 0 | 0 | 0 | 1.500 | 1.000 | 1.000 | 1.500 | 2.500 | 2.500 | 1.000 | 0 | 0 | 0 | 0 | 0 | 4 | 4 | 1.000 |
| 4 | Apr | 3 | 9 | 9 | 8 | 4 | 3 | 3 | 0 | 0 | 0 | 0 | 0 | 4 | 1 | 1 | 0 | 0 | 0 | 0 | 0 | 0.889 | 0.444 | 0.444 | 0.375 | 0.819 | 0.819 | 0.375 | 0 | 2 | 0 | 0 | 0 | 6 | 2 | 0.333 |
| 9 | Sep | 1 | 4 | 4 | 4 | 3 | 3 | 2 | 0 | 0 | 1 | 1 | 0 | 2 | 0 | 0 | 0 | 0 | 0 | 0 | 0 | 1.000 | 0.750 | 0.750 | 1.500 | 2.250 | 2.250 | 0.750 | 0 | 0 | 0 | 0 | 0 | 2 | 1 | 0.500 |
| 10 | Oct | 4 | 12 | 11 | 11 | 3 | 8 | 8 | 0 | 0 | 0 | 0 | 0 | 5 | 1 | 0 | 1 | 0 | 1 | 1 | 0 | 0.667 | 0.750 | 0.727 | 0.727 | 1.477 | 1.455 | 0.727 | 0 | 2 | 0 | 0 | 0 | 8 | 6 | 0.750 |
| 11 | Nov | 3 | 12 | 12 | 12 | 5 | 7 | 6 | 0 | 0 | 1 | 1 | 0 | 4 | 0 | 0 | 0 | 0 | 0 | 0 | 0 | 0.667 | 0.583 | 0.583 | 0.833 | 1.417 | 1.417 | 0.583 | 0 | 2 | 0 | 0 | 0 | 7 | 3 | 0.429 |
| TOTALS | 13 | 44 | 42 | 41 | 21 | 27 | 23 | 1 | 1 | 2 | 2 | 0 | 19 | 3 | 1 | 2 | 0 | 1 | 1 | 0 | 0.864 | 0.682 | 0.667 | 0.878 | 1.560 | 1.545 | 0.659 | 0 | 6 | 0 | 0 | 0 | 29 | 18 | 0.621 |
| # | MONTH | PA | 1B | 2B | 3B | IHR | OHR | ABB | RBB | Kc | Ks | SF | ROE | FC | GDP | GTP | Other |
|---|---|---|---|---|---|---|---|---|---|---|---|---|---|---|---|---|---|
| 2 | Feb | 3 | 33.3% | 33.3% | 0.0% | 0.0% | 0.0% | 33.3% | 0.0% | 0.0% | 0.0% | 0.0% | 0.0% | 0.0% | 0.0% | 0.0% | 0.0% |
| 3 | Mar | 4 | 75.0% | 0.0% | 25.0% | 0.0% | 0.0% | 0.0% | 0.0% | 0.0% | 0.0% | 0.0% | 0.0% | 0.0% | 0.0% | 0.0% | 0.0% |
| 4 | Apr | 9 | 33.3% | 0.0% | 0.0% | 0.0% | 0.0% | 0.0% | 11.1% | 0.0% | 0.0% | 0.0% | 0.0% | 22.2% | 0.0% | 0.0% | 33.3% |
| 9 | Sep | 4 | 50.0% | 0.0% | 0.0% | 25.0% | 0.0% | 0.0% | 0.0% | 0.0% | 0.0% | 0.0% | 0.0% | 0.0% | 0.0% | 0.0% | 25.0% |
| 10 | Oct | 12 | 66.7% | 0.0% | 0.0% | 0.0% | 0.0% | 8.3% | 0.0% | 0.0% | 8.3% | 0.0% | 0.0% | 16.7% | 0.0% | 0.0% | 0.0% |
| 11 | Nov | 12 | 50.0% | 0.0% | 0.0% | 8.3% | 0.0% | 0.0% | 0.0% | 0.0% | 0.0% | 0.0% | 0.0% | 16.7% | 0.0% | 0.0% | 25.0% |
| TOTALS | 44 | 52.3% | 2.3% | 2.3% | 4.5% | 0.0% | 4.5% | 2.3% | 0.0% | 2.3% | 0.0% | 0.0% | 13.6% | 0.0% | 0.0% | 15.9% |
| # | MONTH | Actual PA | 1B | 2B | 3B | IHR | OHR | RBB | Kc | Ks | SF | ROE | FC | GDP | GTP | Other |
|---|---|---|---|---|---|---|---|---|---|---|---|---|---|---|---|---|
| 2 | Feb | 2 | 50.0% | 50.0% | 0.0% | 0.0% | 0.0% | 0.0% | 0.0% | 0.0% | 0.0% | 0.0% | 0.0% | 0.0% | 0.0% | 0.0% |
| 3 | Mar | 4 | 75.0% | 0.0% | 25.0% | 0.0% | 0.0% | 0.0% | 0.0% | 0.0% | 0.0% | 0.0% | 0.0% | 0.0% | 0.0% | 0.0% |
| 4 | Apr | 9 | 33.3% | 0.0% | 0.0% | 0.0% | 0.0% | 11.1% | 0.0% | 0.0% | 0.0% | 0.0% | 22.2% | 0.0% | 0.0% | 33.3% |
| 9 | Sep | 4 | 50.0% | 0.0% | 0.0% | 25.0% | 0.0% | 0.0% | 0.0% | 0.0% | 0.0% | 0.0% | 0.0% | 0.0% | 0.0% | 25.0% |
| 10 | Oct | 11 | 72.7% | 0.0% | 0.0% | 0.0% | 0.0% | 0.0% | 0.0% | 9.1% | 0.0% | 0.0% | 18.2% | 0.0% | 0.0% | 0.0% |
| 11 | Nov | 12 | 50.0% | 0.0% | 0.0% | 8.3% | 0.0% | 0.0% | 0.0% | 0.0% | 0.0% | 0.0% | 16.7% | 0.0% | 0.0% | 25.0% |
| TOTALS | 42 | 54.8% | 2.4% | 2.4% | 4.8% | 0.0% | 2.4% | 0.0% | 2.4% | 0.0% | 0.0% | 14.3% | 0.0% | 0.0% | 16.7% |
| TIME | G | PA | Actual PA | AB | R | H | 1B | 2B | 3B | HR | IHR | OHR | RBI | BB | RBB | ABB | Kc | Ks | SO | SF | RPA | OBP | ROBP | SLG | OPS | ROPS | AVG | ROE | FC | CI | GDP | GTP | AB/RSP | H/RSP | BA/RSP |
|---|---|---|---|---|---|---|---|---|---|---|---|---|---|---|---|---|---|---|---|---|---|---|---|---|---|---|---|---|---|---|---|---|---|---|---|
| 6:30pm | 4 | 15 | 14 | 14 | 8 | 8 | 6 | 1 | 0 | 1 | 1 | 0 | 5 | 1 | 0 | 1 | 0 | 0 | 0 | 0 | 0.800 | 0.600 | 0.571 | 0.857 | 1.457 | 1.429 | 0.571 | 0 | 1 | 0 | 0 | 0 | 8 | 4 | 0.500 |
| 7:25pm | 1 | 3 | 3 | 3 | 1 | 3 | 3 | 0 | 0 | 0 | 0 | 0 | 1 | 0 | 0 | 0 | 0 | 0 | 0 | 0 | 0.667 | 1.000 | 1.000 | 1.000 | 2.000 | 2.000 | 1.000 | 0 | 0 | 0 | 0 | 0 | 3 | 3 | 1.000 |
| 8:20pm | 4 | 13 | 13 | 12 | 8 | 9 | 8 | 0 | 1 | 0 | 0 | 0 | 8 | 1 | 1 | 0 | 0 | 1 | 1 | 0 | 1.231 | 0.769 | 0.769 | 0.917 | 1.686 | 1.686 | 0.750 | 0 | 1 | 0 | 0 | 0 | 9 | 7 | 0.778 |
| 9:15pm | 4 | 13 | 12 | 12 | 4 | 7 | 6 | 0 | 0 | 1 | 1 | 0 | 5 | 1 | 0 | 1 | 0 | 0 | 0 | 0 | 0.615 | 0.615 | 0.583 | 0.833 | 1.449 | 1.417 | 0.583 | 0 | 4 | 0 | 0 | 0 | 9 | 4 | 0.444 |
| TOTALS | 13 | 44 | 42 | 41 | 21 | 27 | 23 | 1 | 1 | 2 | 2 | 0 | 19 | 3 | 1 | 2 | 0 | 1 | 1 | 0 | 0.864 | 0.682 | 0.667 | 0.878 | 1.560 | 1.545 | 0.659 | 0 | 6 | 0 | 0 | 0 | 29 | 18 | 0.621 |
| TIME | PA | 1B | 2B | 3B | IHR | OHR | ABB | RBB | Kc | Ks | SF | ROE | FC | GDP | GTP | Other |
|---|---|---|---|---|---|---|---|---|---|---|---|---|---|---|---|---|
| 6:30pm | 15 | 40.0% | 6.7% | 0.0% | 6.7% | 0.0% | 6.7% | 0.0% | 0.0% | 0.0% | 0.0% | 0.0% | 6.7% | 0.0% | 0.0% | 33.3% |
| 7:25pm | 3 | 100.0% | 0.0% | 0.0% | 0.0% | 0.0% | 0.0% | 0.0% | 0.0% | 0.0% | 0.0% | 0.0% | 0.0% | 0.0% | 0.0% | 0.0% |
| 8:20pm | 13 | 61.5% | 0.0% | 7.7% | 0.0% | 0.0% | 0.0% | 7.7% | 0.0% | 7.7% | 0.0% | 0.0% | 7.7% | 0.0% | 0.0% | 7.7% |
| 9:15pm | 13 | 46.2% | 0.0% | 0.0% | 7.7% | 0.0% | 7.7% | 0.0% | 0.0% | 0.0% | 0.0% | 0.0% | 30.8% | 0.0% | 0.0% | 7.7% |
| TOTALS | 44 | 52.3% | 2.3% | 2.3% | 4.5% | 0.0% | 4.5% | 2.3% | 0.0% | 2.3% | 0.0% | 0.0% | 13.6% | 0.0% | 0.0% | 15.9% |
| TIME | Actual PA | 1B | 2B | 3B | IHR | OHR | RBB | Kc | Ks | SF | ROE | FC | GDP | GTP | Other |
|---|---|---|---|---|---|---|---|---|---|---|---|---|---|---|---|
| 6:30pm | 14 | 42.9% | 7.1% | 0.0% | 7.1% | 0.0% | 0.0% | 0.0% | 0.0% | 0.0% | 0.0% | 7.1% | 0.0% | 0.0% | 35.7% |
| 7:25pm | 3 | 100.0% | 0.0% | 0.0% | 0.0% | 0.0% | 0.0% | 0.0% | 0.0% | 0.0% | 0.0% | 0.0% | 0.0% | 0.0% | 0.0% |
| 8:20pm | 13 | 61.5% | 0.0% | 7.7% | 0.0% | 0.0% | 7.7% | 0.0% | 7.7% | 0.0% | 0.0% | 7.7% | 0.0% | 0.0% | 7.7% |
| 9:15pm | 12 | 50.0% | 0.0% | 0.0% | 8.3% | 0.0% | 0.0% | 0.0% | 0.0% | 0.0% | 0.0% | 33.3% | 0.0% | 0.0% | 8.3% |
| TOTALS | 42 | 54.8% | 2.4% | 2.4% | 4.8% | 0.0% | 2.4% | 0.0% | 2.4% | 0.0% | 0.0% | 14.3% | 0.0% | 0.0% | 16.7% |
| # | SEASON | G | PA | Actual PA | AB | R | H | 1B | 2B | 3B | HR | IHR | OHR | RBI | BB | RBB | ABB | Kc | Ks | SO | SF | RPA | OBP | ROBP | SLG | OPS | ROPS | AVG | ROE | FC | CI | GDP | GTP | AB/RSP | H/RSP | BA/RSP |
|---|---|---|---|---|---|---|---|---|---|---|---|---|---|---|---|---|---|---|---|---|---|---|---|---|---|---|---|---|---|---|---|---|---|---|---|---|
| 56 | Fall '10 | 4 | 12 | 11 | 11 | 4 | 7 | 6 | 0 | 0 | 1 | 1 | 0 | 5 | 1 | 0 | 1 | 0 | 0 | 0 | 0 | 0.667 | 0.667 | 0.636 | 0.909 | 1.576 | 1.545 | 0.636 | 0 | 3 | 0 | 0 | 0 | 9 | 5 | 0.556 |
| 59 | Summer I '11 | 1 | 3 | 3 | 3 | 2 | 2 | 2 | 0 | 0 | 0 | 0 | 0 | 2 | 0 | 0 | 0 | 0 | 0 | 0 | 0 | 1.333 | 0.667 | 0.667 | 0.667 | 1.333 | 1.333 | 0.667 | 0 | 1 | 0 | 0 | 0 | 2 | 1 | 0.500 |
| 60 | Summer II '11 | 1 | 4 | 4 | 4 | 3 | 3 | 2 | 0 | 0 | 1 | 1 | 0 | 2 | 0 | 0 | 0 | 0 | 0 | 0 | 0 | 1.000 | 0.750 | 0.750 | 1.500 | 2.250 | 2.250 | 0.750 | 0 | 0 | 0 | 0 | 0 | 2 | 1 | 0.500 |
| 61 | Fall '11 | 3 | 12 | 12 | 12 | 4 | 8 | 8 | 0 | 0 | 0 | 0 | 0 | 4 | 0 | 0 | 0 | 0 | 1 | 1 | 0 | 0.667 | 0.667 | 0.667 | 0.667 | 1.333 | 1.333 | 0.667 | 0 | 1 | 0 | 0 | 0 | 6 | 4 | 0.667 |
| 62 | Winter '12 | 2 | 7 | 6 | 6 | 6 | 6 | 4 | 1 | 1 | 0 | 0 | 0 | 4 | 1 | 0 | 1 | 0 | 0 | 0 | 0 | 1.429 | 1.000 | 1.000 | 1.500 | 2.500 | 2.500 | 1.000 | 0 | 0 | 0 | 0 | 0 | 6 | 6 | 1.000 |
| 63 | Spring '12 | 2 | 6 | 6 | 5 | 2 | 1 | 1 | 0 | 0 | 0 | 0 | 0 | 2 | 1 | 1 | 0 | 0 | 0 | 0 | 0 | 0.667 | 0.333 | 0.333 | 0.200 | 0.533 | 0.533 | 0.200 | 0 | 1 | 0 | 0 | 0 | 4 | 1 | 0.250 |
| TOTALS | 13 | 44 | 42 | 41 | 21 | 27 | 23 | 1 | 1 | 2 | 2 | 0 | 19 | 3 | 1 | 2 | 0 | 1 | 1 | 0 | 0.864 | 0.682 | 0.667 | 0.878 | 1.560 | 1.545 | 0.659 | 0 | 6 | 0 | 0 | 0 | 29 | 18 | 0.621 |
| # | SEASON | PA | 1B | 2B | 3B | IHR | OHR | ABB | RBB | Kc | Ks | SF | ROE | FC | GDP | GTP | Other |
|---|---|---|---|---|---|---|---|---|---|---|---|---|---|---|---|---|---|
| 56 | Fall '10 | 12 | 50.0% | 0.0% | 0.0% | 8.3% | 0.0% | 8.3% | 0.0% | 0.0% | 0.0% | 0.0% | 0.0% | 25.0% | 0.0% | 0.0% | 8.3% |
| 59 | Summer I '11 | 3 | 66.7% | 0.0% | 0.0% | 0.0% | 0.0% | 0.0% | 0.0% | 0.0% | 0.0% | 0.0% | 0.0% | 33.3% | 0.0% | 0.0% | 0.0% |
| 60 | Summer II '11 | 4 | 50.0% | 0.0% | 0.0% | 25.0% | 0.0% | 0.0% | 0.0% | 0.0% | 0.0% | 0.0% | 0.0% | 0.0% | 0.0% | 0.0% | 25.0% |
| 61 | Fall '11 | 12 | 66.7% | 0.0% | 0.0% | 0.0% | 0.0% | 0.0% | 0.0% | 0.0% | 8.3% | 0.0% | 0.0% | 8.3% | 0.0% | 0.0% | 16.7% |
| 62 | Winter '12 | 7 | 57.1% | 14.3% | 14.3% | 0.0% | 0.0% | 14.3% | 0.0% | 0.0% | 0.0% | 0.0% | 0.0% | 0.0% | 0.0% | 0.0% | 0.0% |
| 63 | Spring '12 | 6 | 16.7% | 0.0% | 0.0% | 0.0% | 0.0% | 0.0% | 16.7% | 0.0% | 0.0% | 0.0% | 0.0% | 16.7% | 0.0% | 0.0% | 50.0% |
| TOTALS | 44 | 52.3% | 2.3% | 2.3% | 4.5% | 0.0% | 4.5% | 2.3% | 0.0% | 2.3% | 0.0% | 0.0% | 13.6% | 0.0% | 0.0% | 15.9% |
| # | SEASON | Actual PA | 1B | 2B | 3B | IHR | OHR | RBB | Kc | Ks | SF | ROE | FC | GDP | GTP | Other |
|---|---|---|---|---|---|---|---|---|---|---|---|---|---|---|---|---|
| 56 | Fall '10 | 11 | 54.5% | 0.0% | 0.0% | 9.1% | 0.0% | 0.0% | 0.0% | 0.0% | 0.0% | 0.0% | 27.3% | 0.0% | 0.0% | 9.1% |
| 59 | Summer I '11 | 3 | 66.7% | 0.0% | 0.0% | 0.0% | 0.0% | 0.0% | 0.0% | 0.0% | 0.0% | 0.0% | 33.3% | 0.0% | 0.0% | 0.0% |
| 60 | Summer II '11 | 4 | 50.0% | 0.0% | 0.0% | 25.0% | 0.0% | 0.0% | 0.0% | 0.0% | 0.0% | 0.0% | 0.0% | 0.0% | 0.0% | 25.0% |
| 61 | Fall '11 | 12 | 66.7% | 0.0% | 0.0% | 0.0% | 0.0% | 0.0% | 0.0% | 8.3% | 0.0% | 0.0% | 8.3% | 0.0% | 0.0% | 16.7% |
| 62 | Winter '12 | 6 | 66.7% | 16.7% | 16.7% | 0.0% | 0.0% | 0.0% | 0.0% | 0.0% | 0.0% | 0.0% | 0.0% | 0.0% | 0.0% | 0.0% |
| 63 | Spring '12 | 6 | 16.7% | 0.0% | 0.0% | 0.0% | 0.0% | 16.7% | 0.0% | 0.0% | 0.0% | 0.0% | 16.7% | 0.0% | 0.0% | 50.0% |
| TOTALS | 42 | 54.8% | 2.4% | 2.4% | 4.8% | 0.0% | 2.4% | 0.0% | 2.4% | 0.0% | 0.0% | 14.3% | 0.0% | 0.0% | 16.7% |
| OPPONENT | G | PA | Actual PA | AB | R | H | 1B | 2B | 3B | HR | IHR | OHR | RBI | BB | RBB | ABB | Kc | Ks | SO | SF | RPA | OBP | ROBP | SLG | OPS | ROPS | AVG | ROE | FC | CI | GDP | GTP | AB/RSP | H/RSP | BA/RSP |
|---|---|---|---|---|---|---|---|---|---|---|---|---|---|---|---|---|---|---|---|---|---|---|---|---|---|---|---|---|---|---|---|---|---|---|---|
| ATX Outlaws | 1 | 3 | 2 | 2 | 1 | 1 | 1 | 0 | 0 | 0 | 0 | 0 | 1 | 1 | 0 | 1 | 0 | 0 | 0 | 0 | 0.667 | 0.667 | 0.500 | 0.500 | 1.167 | 1.000 | 0.500 | 0 | 1 | 0 | 0 | 0 | 2 | 1 | 0.500 |
| Bangers And Mash | 1 | 3 | 3 | 3 | 2 | 2 | 2 | 0 | 0 | 0 | 0 | 0 | 2 | 0 | 0 | 0 | 0 | 0 | 0 | 0 | 1.333 | 0.667 | 0.667 | 0.667 | 1.333 | 1.333 | 0.667 | 0 | 1 | 0 | 0 | 0 | 2 | 1 | 0.500 |
| EoM | 2 | 6 | 6 | 6 | 3 | 4 | 3 | 0 | 0 | 1 | 1 | 0 | 3 | 0 | 0 | 0 | 0 | 0 | 0 | 0 | 0.833 | 0.667 | 0.667 | 1.167 | 1.833 | 1.833 | 0.667 | 0 | 1 | 0 | 0 | 0 | 5 | 3 | 0.600 |
| Marauders | 1 | 3 | 3 | 3 | 0 | 2 | 2 | 0 | 0 | 0 | 0 | 0 | 1 | 0 | 0 | 0 | 0 | 0 | 0 | 0 | 0.333 | 0.667 | 0.667 | 0.667 | 1.333 | 1.333 | 0.667 | 0 | 1 | 0 | 0 | 0 | 2 | 1 | 0.500 |
| Orange Crush | 2 | 7 | 7 | 7 | 1 | 3 | 3 | 0 | 0 | 0 | 0 | 0 | 2 | 0 | 0 | 0 | 0 | 0 | 0 | 0 | 0.429 | 0.429 | 0.429 | 0.429 | 0.857 | 0.857 | 0.429 | 0 | 2 | 0 | 0 | 0 | 5 | 2 | 0.400 |
| Spinners | 2 | 8 | 8 | 8 | 3 | 5 | 5 | 0 | 0 | 0 | 0 | 0 | 3 | 0 | 0 | 0 | 0 | 1 | 1 | 0 | 0.750 | 0.625 | 0.625 | 0.625 | 1.250 | 1.250 | 0.625 | 0 | 0 | 0 | 0 | 0 | 3 | 2 | 0.667 |
| The Shockers | 2 | 7 | 6 | 6 | 6 | 6 | 4 | 1 | 1 | 0 | 0 | 0 | 4 | 1 | 0 | 1 | 0 | 0 | 0 | 0 | 1.429 | 1.000 | 1.000 | 1.500 | 2.500 | 2.500 | 1.000 | 0 | 0 | 0 | 0 | 0 | 6 | 6 | 1.000 |
| UFCU Orange Sox | 1 | 3 | 3 | 2 | 2 | 1 | 1 | 0 | 0 | 0 | 0 | 0 | 1 | 1 | 1 | 0 | 0 | 0 | 0 | 0 | 1.000 | 0.667 | 0.667 | 0.500 | 1.167 | 1.167 | 0.500 | 0 | 0 | 0 | 0 | 0 | 2 | 1 | 0.500 |
| Untouchaballs | 1 | 4 | 4 | 4 | 3 | 3 | 2 | 0 | 0 | 1 | 1 | 0 | 2 | 0 | 0 | 0 | 0 | 0 | 0 | 0 | 1.000 | 0.750 | 0.750 | 1.500 | 2.250 | 2.250 | 0.750 | 0 | 0 | 0 | 0 | 0 | 2 | 1 | 0.500 |
| TOTALS | 13 | 44 | 42 | 41 | 21 | 27 | 23 | 1 | 1 | 2 | 2 | 0 | 19 | 3 | 1 | 2 | 0 | 1 | 1 | 0 | 0.864 | 0.682 | 0.667 | 0.878 | 1.560 | 1.545 | 0.659 | 0 | 6 | 0 | 0 | 0 | 29 | 18 | 0.621 |
| OPPONENT | PA | 1B | 2B | 3B | IHR | OHR | ABB | RBB | Kc | Ks | SF | ROE | FC | GDP | GTP | Other |
|---|---|---|---|---|---|---|---|---|---|---|---|---|---|---|---|---|
| ATX Outlaws | 3 | 33.3% | 0.0% | 0.0% | 0.0% | 0.0% | 33.3% | 0.0% | 0.0% | 0.0% | 0.0% | 0.0% | 33.3% | 0.0% | 0.0% | 0.0% |
| Bangers And Mash | 3 | 66.7% | 0.0% | 0.0% | 0.0% | 0.0% | 0.0% | 0.0% | 0.0% | 0.0% | 0.0% | 0.0% | 33.3% | 0.0% | 0.0% | 0.0% |
| EoM | 6 | 50.0% | 0.0% | 0.0% | 16.7% | 0.0% | 0.0% | 0.0% | 0.0% | 0.0% | 0.0% | 0.0% | 16.7% | 0.0% | 0.0% | 16.7% |
| Marauders | 3 | 66.7% | 0.0% | 0.0% | 0.0% | 0.0% | 0.0% | 0.0% | 0.0% | 0.0% | 0.0% | 0.0% | 33.3% | 0.0% | 0.0% | 0.0% |
| Orange Crush | 7 | 42.9% | 0.0% | 0.0% | 0.0% | 0.0% | 0.0% | 0.0% | 0.0% | 0.0% | 0.0% | 0.0% | 28.6% | 0.0% | 0.0% | 28.6% |
| Spinners | 8 | 62.5% | 0.0% | 0.0% | 0.0% | 0.0% | 0.0% | 0.0% | 0.0% | 12.5% | 0.0% | 0.0% | 0.0% | 0.0% | 0.0% | 25.0% |
| The Shockers | 7 | 57.1% | 14.3% | 14.3% | 0.0% | 0.0% | 14.3% | 0.0% | 0.0% | 0.0% | 0.0% | 0.0% | 0.0% | 0.0% | 0.0% | 0.0% |
| UFCU Orange Sox | 3 | 33.3% | 0.0% | 0.0% | 0.0% | 0.0% | 0.0% | 33.3% | 0.0% | 0.0% | 0.0% | 0.0% | 0.0% | 0.0% | 0.0% | 33.3% |
| Untouchaballs | 4 | 50.0% | 0.0% | 0.0% | 25.0% | 0.0% | 0.0% | 0.0% | 0.0% | 0.0% | 0.0% | 0.0% | 0.0% | 0.0% | 0.0% | 25.0% |
| TOTALS | 44 | 52.3% | 2.3% | 2.3% | 4.5% | 0.0% | 4.5% | 2.3% | 0.0% | 2.3% | 0.0% | 0.0% | 13.6% | 0.0% | 0.0% | 15.9% |
| OPPONENT | Actual PA | 1B | 2B | 3B | IHR | OHR | RBB | Kc | Ks | SF | ROE | FC | GDP | GTP | Other |
|---|---|---|---|---|---|---|---|---|---|---|---|---|---|---|---|
| ATX Outlaws | 2 | 50.0% | 0.0% | 0.0% | 0.0% | 0.0% | 0.0% | 0.0% | 0.0% | 0.0% | 0.0% | 50.0% | 0.0% | 0.0% | 0.0% |
| Bangers And Mash | 3 | 66.7% | 0.0% | 0.0% | 0.0% | 0.0% | 0.0% | 0.0% | 0.0% | 0.0% | 0.0% | 33.3% | 0.0% | 0.0% | 0.0% |
| EoM | 6 | 50.0% | 0.0% | 0.0% | 16.7% | 0.0% | 0.0% | 0.0% | 0.0% | 0.0% | 0.0% | 16.7% | 0.0% | 0.0% | 16.7% |
| Marauders | 3 | 66.7% | 0.0% | 0.0% | 0.0% | 0.0% | 0.0% | 0.0% | 0.0% | 0.0% | 0.0% | 33.3% | 0.0% | 0.0% | 0.0% |
| Orange Crush | 7 | 42.9% | 0.0% | 0.0% | 0.0% | 0.0% | 0.0% | 0.0% | 0.0% | 0.0% | 0.0% | 28.6% | 0.0% | 0.0% | 28.6% |
| Spinners | 8 | 62.5% | 0.0% | 0.0% | 0.0% | 0.0% | 0.0% | 0.0% | 12.5% | 0.0% | 0.0% | 0.0% | 0.0% | 0.0% | 25.0% |
| The Shockers | 6 | 66.7% | 16.7% | 16.7% | 0.0% | 0.0% | 0.0% | 0.0% | 0.0% | 0.0% | 0.0% | 0.0% | 0.0% | 0.0% | 0.0% |
| UFCU Orange Sox | 3 | 33.3% | 0.0% | 0.0% | 0.0% | 0.0% | 33.3% | 0.0% | 0.0% | 0.0% | 0.0% | 0.0% | 0.0% | 0.0% | 33.3% |
| Untouchaballs | 4 | 50.0% | 0.0% | 0.0% | 25.0% | 0.0% | 0.0% | 0.0% | 0.0% | 0.0% | 0.0% | 0.0% | 0.0% | 0.0% | 25.0% |
| TOTALS | 42 | 54.8% | 2.4% | 2.4% | 4.8% | 0.0% | 2.4% | 0.0% | 2.4% | 0.0% | 0.0% | 14.3% | 0.0% | 0.0% | 16.7% |
| FIELD | G | PA | Actual PA | AB | R | H | 1B | 2B | 3B | HR | IHR | OHR | RBI | BB | RBB | ABB | Kc | Ks | SO | SF | RPA | OBP | ROBP | SLG | OPS | ROPS | AVG | ROE | FC | CI | GDP | GTP | AB/RSP | H/RSP | BA/RSP |
|---|---|---|---|---|---|---|---|---|---|---|---|---|---|---|---|---|---|---|---|---|---|---|---|---|---|---|---|---|---|---|---|---|---|---|---|
| Havins 1 | 3 | 9 | 8 | 8 | 6 | 6 | 5 | 1 | 0 | 0 | 0 | 0 | 5 | 1 | 0 | 1 | 0 | 1 | 1 | 0 | 1.222 | 0.778 | 0.750 | 0.875 | 1.653 | 1.625 | 0.750 | 0 | 1 | 0 | 0 | 0 | 5 | 4 | 0.800 |
| Havins 2 | 2 | 7 | 7 | 7 | 5 | 5 | 3 | 0 | 1 | 1 | 1 | 0 | 5 | 0 | 0 | 0 | 0 | 0 | 0 | 0 | 1.286 | 0.714 | 0.714 | 1.429 | 2.143 | 2.143 | 0.714 | 0 | 1 | 0 | 0 | 0 | 6 | 4 | 0.667 |
| Havins 3 | 4 | 14 | 14 | 14 | 4 | 8 | 7 | 0 | 0 | 1 | 1 | 0 | 5 | 0 | 0 | 0 | 0 | 0 | 0 | 0 | 0.571 | 0.571 | 0.571 | 0.786 | 1.357 | 1.357 | 0.571 | 0 | 3 | 0 | 0 | 0 | 9 | 4 | 0.444 |
| Havins 4 | 3 | 11 | 11 | 10 | 5 | 7 | 7 | 0 | 0 | 0 | 0 | 0 | 3 | 1 | 1 | 0 | 0 | 0 | 0 | 0 | 0.727 | 0.727 | 0.727 | 0.700 | 1.427 | 1.427 | 0.700 | 0 | 0 | 0 | 0 | 0 | 7 | 5 | 0.714 |
| Havins 5 | 1 | 3 | 2 | 2 | 1 | 1 | 1 | 0 | 0 | 0 | 0 | 0 | 1 | 1 | 0 | 1 | 0 | 0 | 0 | 0 | 0.667 | 0.667 | 0.500 | 0.500 | 1.167 | 1.000 | 0.500 | 0 | 1 | 0 | 0 | 0 | 2 | 1 | 0.500 |
| TOTALS | 13 | 44 | 42 | 41 | 21 | 27 | 23 | 1 | 1 | 2 | 2 | 0 | 19 | 3 | 1 | 2 | 0 | 1 | 1 | 0 | 0.864 | 0.682 | 0.667 | 0.878 | 1.560 | 1.545 | 0.659 | 0 | 6 | 0 | 0 | 0 | 29 | 18 | 0.621 |
| FIELD | PA | 1B | 2B | 3B | IHR | OHR | ABB | RBB | Kc | Ks | SF | ROE | FC | GDP | GTP | Other |
|---|---|---|---|---|---|---|---|---|---|---|---|---|---|---|---|---|
| Havins 1 | 9 | 55.6% | 11.1% | 0.0% | 0.0% | 0.0% | 11.1% | 0.0% | 0.0% | 11.1% | 0.0% | 0.0% | 11.1% | 0.0% | 0.0% | 0.0% |
| Havins 2 | 7 | 42.9% | 0.0% | 14.3% | 14.3% | 0.0% | 0.0% | 0.0% | 0.0% | 0.0% | 0.0% | 0.0% | 14.3% | 0.0% | 0.0% | 14.3% |
| Havins 3 | 14 | 50.0% | 0.0% | 0.0% | 7.1% | 0.0% | 0.0% | 0.0% | 0.0% | 0.0% | 0.0% | 0.0% | 21.4% | 0.0% | 0.0% | 21.4% |
| Havins 4 | 11 | 63.6% | 0.0% | 0.0% | 0.0% | 0.0% | 0.0% | 9.1% | 0.0% | 0.0% | 0.0% | 0.0% | 0.0% | 0.0% | 0.0% | 27.3% |
| Havins 5 | 3 | 33.3% | 0.0% | 0.0% | 0.0% | 0.0% | 33.3% | 0.0% | 0.0% | 0.0% | 0.0% | 0.0% | 33.3% | 0.0% | 0.0% | 0.0% |
| TOTALS | 44 | 52.3% | 2.3% | 2.3% | 4.5% | 0.0% | 4.5% | 2.3% | 0.0% | 2.3% | 0.0% | 0.0% | 13.6% | 0.0% | 0.0% | 15.9% |
| FIELD | Actual PA | 1B | 2B | 3B | IHR | OHR | RBB | Kc | Ks | SF | ROE | FC | GDP | GTP | Other |
|---|---|---|---|---|---|---|---|---|---|---|---|---|---|---|---|
| Havins 1 | 8 | 62.5% | 12.5% | 0.0% | 0.0% | 0.0% | 0.0% | 0.0% | 12.5% | 0.0% | 0.0% | 12.5% | 0.0% | 0.0% | 0.0% |
| Havins 2 | 7 | 42.9% | 0.0% | 14.3% | 14.3% | 0.0% | 0.0% | 0.0% | 0.0% | 0.0% | 0.0% | 14.3% | 0.0% | 0.0% | 14.3% |
| Havins 3 | 14 | 50.0% | 0.0% | 0.0% | 7.1% | 0.0% | 0.0% | 0.0% | 0.0% | 0.0% | 0.0% | 21.4% | 0.0% | 0.0% | 21.4% |
| Havins 4 | 11 | 63.6% | 0.0% | 0.0% | 0.0% | 0.0% | 9.1% | 0.0% | 0.0% | 0.0% | 0.0% | 0.0% | 0.0% | 0.0% | 27.3% |
| Havins 5 | 2 | 50.0% | 0.0% | 0.0% | 0.0% | 0.0% | 0.0% | 0.0% | 0.0% | 0.0% | 0.0% | 50.0% | 0.0% | 0.0% | 0.0% |
| TOTALS | 42 | 54.8% | 2.4% | 2.4% | 4.8% | 0.0% | 2.4% | 0.0% | 2.4% | 0.0% | 0.0% | 14.3% | 0.0% | 0.0% | 16.7% |
| # | GAME | PA | Actual PA | AB | R | H | 1B | 2B | 3B | HR | IHR | OHR | RBI | BB | RBB | ABB | Kc | Ks | SO | SF | RPA | OBP | ROBP | SLG | OPS | ROPS | AVG | ROE | FC | CI | GDP | GTP | AB/RSP | H/RSP | BA/RSP |
|---|---|---|---|---|---|---|---|---|---|---|---|---|---|---|---|---|---|---|---|---|---|---|---|---|---|---|---|---|---|---|---|---|---|---|---|
| 56-2 | Fall '10, Game 2 | 3 | 3 | 3 | 0 | 2 | 2 | 0 | 0 | 0 | 0 | 0 | 1 | 0 | 0 | 0 | 0 | 0 | 0 | 0 | 0.333 | 0.667 | 0.667 | 0.667 | 1.333 | 1.333 | 0.667 | 0 | 1 | 0 | 0 | 0 | 2 | 1 | 0.500 |
| 56-3 | Fall '10, Game 3 | 3 | 3 | 3 | 1 | 3 | 3 | 0 | 0 | 0 | 0 | 0 | 1 | 0 | 0 | 0 | 0 | 0 | 0 | 0 | 0.667 | 1.000 | 1.000 | 1.000 | 2.000 | 2.000 | 1.000 | 0 | 0 | 0 | 0 | 0 | 3 | 3 | 1.000 |
| 56-4 | Fall '10, Game 4 | 3 | 2 | 2 | 1 | 1 | 1 | 0 | 0 | 0 | 0 | 0 | 1 | 1 | 0 | 1 | 0 | 0 | 0 | 0 | 0.667 | 0.667 | 0.500 | 0.500 | 1.167 | 1.000 | 0.500 | 0 | 1 | 0 | 0 | 0 | 2 | 1 | 0.500 |
| 56-6 | Fall '10, Game 6 | 3 | 3 | 3 | 2 | 1 | 0 | 0 | 0 | 1 | 1 | 0 | 2 | 0 | 0 | 0 | 0 | 0 | 0 | 0 | 1.000 | 0.333 | 0.333 | 1.333 | 1.667 | 1.667 | 0.333 | 0 | 1 | 0 | 0 | 0 | 2 | 0 | 0.000 |
| 59-2 | Summer I '11, Game 2 | 3 | 3 | 3 | 2 | 2 | 2 | 0 | 0 | 0 | 0 | 0 | 2 | 0 | 0 | 0 | 0 | 0 | 0 | 0 | 1.333 | 0.667 | 0.667 | 0.667 | 1.333 | 1.333 | 0.667 | 0 | 1 | 0 | 0 | 0 | 2 | 1 | 0.500 |
| 60-7 | Summer II '11, Game 7 | 4 | 4 | 4 | 3 | 3 | 2 | 0 | 0 | 1 | 1 | 0 | 2 | 0 | 0 | 0 | 0 | 0 | 0 | 0 | 1.000 | 0.750 | 0.750 | 1.500 | 2.250 | 2.250 | 0.750 | 0 | 0 | 0 | 0 | 0 | 2 | 1 | 0.500 |
| 61-3 | Fall '11, Game 3 | 3 | 3 | 3 | 1 | 2 | 2 | 0 | 0 | 0 | 0 | 0 | 2 | 0 | 0 | 0 | 0 | 1 | 1 | 0 | 1.000 | 0.667 | 0.667 | 0.667 | 1.333 | 1.333 | 0.667 | 0 | 0 | 0 | 0 | 0 | 1 | 1 | 1.000 |
| 61-5 | Fall '11, Game 5 | 4 | 4 | 4 | 1 | 3 | 3 | 0 | 0 | 0 | 0 | 0 | 1 | 0 | 0 | 0 | 0 | 0 | 0 | 0 | 0.500 | 0.750 | 0.750 | 0.750 | 1.500 | 1.500 | 0.750 | 0 | 1 | 0 | 0 | 0 | 3 | 2 | 0.667 |
| 61-6 | Fall '11, Game 6 | 5 | 5 | 5 | 2 | 3 | 3 | 0 | 0 | 0 | 0 | 0 | 1 | 0 | 0 | 0 | 0 | 0 | 0 | 0 | 0.600 | 0.600 | 0.600 | 0.600 | 1.200 | 1.200 | 0.600 | 0 | 0 | 0 | 0 | 0 | 2 | 1 | 0.500 |
| 62-2 | Winter '12, Game 2 | 3 | 2 | 2 | 3 | 2 | 1 | 1 | 0 | 0 | 0 | 0 | 1 | 1 | 0 | 1 | 0 | 0 | 0 | 0 | 1.333 | 1.000 | 1.000 | 1.500 | 2.500 | 2.500 | 1.000 | 0 | 0 | 0 | 0 | 0 | 2 | 2 | 1.000 |
| 62-5 | Winter '12, Game 5 | 4 | 4 | 4 | 3 | 4 | 3 | 0 | 1 | 0 | 0 | 0 | 3 | 0 | 0 | 0 | 0 | 0 | 0 | 0 | 1.500 | 1.000 | 1.000 | 1.500 | 2.500 | 2.500 | 1.000 | 0 | 0 | 0 | 0 | 0 | 4 | 4 | 1.000 |
| 63-1 | Spring '12, Game 1 | 3 | 3 | 3 | 0 | 0 | 0 | 0 | 0 | 0 | 0 | 0 | 1 | 0 | 0 | 0 | 0 | 0 | 0 | 0 | 0.333 | 0.000 | 0.000 | 0.000 | 0.000 | 0.000 | 0.000 | 0 | 1 | 0 | 0 | 0 | 2 | 0 | 0.000 |
| 63-2 | Spring '12, Game 2 | 3 | 3 | 2 | 2 | 1 | 1 | 0 | 0 | 0 | 0 | 0 | 1 | 1 | 1 | 0 | 0 | 0 | 0 | 0 | 1.000 | 0.667 | 0.667 | 0.500 | 1.167 | 1.167 | 0.500 | 0 | 0 | 0 | 0 | 0 | 2 | 1 | 0.500 |
| TOTALS | 44 | 42 | 41 | 21 | 27 | 23 | 1 | 1 | 2 | 2 | 0 | 19 | 3 | 1 | 2 | 0 | 1 | 1 | 0 | 0.864 | 0.682 | 0.667 | 0.878 | 1.560 | 1.545 | 0.659 | 0 | 6 | 0 | 0 | 0 | 29 | 18 | 0.621 |
| Summer I '08 | Summer II '08 | Spring '09 | Summer I '09 | Winter '09-'10 |
|---|---|---|---|---|
|
Game 7, LF Game 8, RF Game 9, RF |
Game 1, RF Game 2, RF Game 3, RF Game 4, RF Game 6, RF Game 8, RF |
Game 2, LF/RF Game 6, RF |
Game 8, RF |
Game 1, RF/LF Game 4, RF |
| Fall '10 | Summer I '11 | Summer II '11 | Fall '11 | Winter '12 |
|
Game 2, DH/C/RF/1B Game 3, DH/RF/1B Game 4, DH/C/RF/1B Game 6, C/RF |
Game 2, LF/C | Game 7, C/RF |
Game 3, DH/C/RF/LF Game 5, LF Game 6, C/RF |
Game 2, DH/RF/LF Game 5, DH/RF |
| Spring '12 | ||||
|
Game 1, DH Game 2, DH |
The following is a table of where this player falls within various statistical rankings. The first column (Category) is the name of the statistic. The second column (Value) is the value of that statistic for this player. The third column (Rank) is where this player ranks among all Ice Weasels for the given statistic. The fourth column (Distance To Top) is the number of Ice Weasels who have a better ranking than this player. The fifth column (Number Tied) is the number of players who have an identical ranking. The sixth column (Distance To Bottom) is the number of players who have a lesser rating. The final column (Number Unranked) is the number of Ice Weasels who have no ranking for this category (i.e. they do not qualify)
| Category | Value | Rank | Distance To Top | Number Tied | Distance To Bottom | Number Unranked |
|---|---|---|---|---|---|---|
| Game Appearances | 27 | 43rd | 47 | 0 | 313 | 0 |
| Attendance (min 10 games) | 21.09% (27 of 128 possible games) | 74th | 78 | 0 | 12 | 270 |
| Consecutive Game Streak | 8 | 27th | 52 | 6 | 302 | 0 |
| Seasons Played | 11 | 23rd | 34 | 6 | 320 | 0 |
| Win Percent (min 10 games) | 81.48% | 3rd | 2 | 0 | 88 | 270 |
| Wins | 22 | 34th | 36 | 1 | 323 | 0 |
| Losses | 5 | 43rd | 81 | 7 | 272 | 0 |
| Personal Consecutive Win Streak | 12 | 7th | 12 | 4 | 344 | 0 |
| P | C | 1B | 2B | 3B | SS | LF | LCF | RCF | RF | CF | SF | DH |
|---|---|---|---|---|---|---|---|---|---|---|---|---|
| 0 | 7 | 3 | 0 | 0 | 0 | 7 | 0 | 0 | 22 | 0 | 0 | 8 |
| Fall '10 | Summer I '11 | Summer II '11 | Fall '11 |
|---|---|---|---|
|
Game 2, DH/C/RF/1B Game 4, DH/C/RF/1B Game 6, C/RF |
Game 2, LF/C | Game 7, C/RF |
Game 3, DH/C/RF/LF Game 6, C/RF |
| Category | Value | Rank | Distance To Top | Number Tied | Distance To Bottom | Number Unranked |
|---|---|---|---|---|---|---|
| Appearances | 7 | 26th | 28 | 1 | 331 | 0 |
| Wins | 6 | 19th | 25 | 2 | 333 | 0 |
| Losses | 1 | 26th | 45 | 52 | 263 | 0 |
| Fall '10 |
|---|
|
Game 2, DH/C/RF/1B Game 3, DH/RF/1B Game 4, DH/C/RF/1B |
| Category | Value | Rank | Distance To Top | Number Tied | Distance To Bottom | Number Unranked |
|---|---|---|---|---|---|---|
| Appearances | 3 | 19th | 24 | 5 | 331 | 0 |
| Wins | 2 | 15th | 24 | 8 | 328 | 0 |
| Losses | 1 | 15th | 26 | 33 | 301 | 0 |
| Summer I '08 | Spring '09 | Winter '09-'10 | Summer I '11 | Fall '11 |
|---|---|---|---|---|
| Game 7, LF | Game 2, LF/RF | Game 1, RF/LF | Game 2, LF/C |
Game 3, DH/C/RF/LF Game 5, LF |
| Winter '12 | ||||
| Game 2, DH/RF/LF |
| Category | Value | Rank | Distance To Top | Number Tied | Distance To Bottom | Number Unranked |
|---|---|---|---|---|---|---|
| Appearances | 7 | 20th | 24 | 1 | 335 | 0 |
| Wins | 7 | 13th | 15 | 2 | 343 | 0 |
| Losses | 0 | 18th | 76 | 284 | 0 | 0 |
| Summer I '08 | Summer II '08 | Spring '09 | Summer I '09 | Winter '09-'10 |
|---|---|---|---|---|
|
Game 8, RF Game 9, RF |
Game 1, RF Game 2, RF Game 3, RF Game 4, RF Game 6, RF Game 8, RF |
Game 2, LF/RF Game 6, RF |
Game 8, RF |
Game 1, RF/LF Game 4, RF |
| Fall '10 | Summer II '11 | Fall '11 | Winter '12 | |
|
Game 2, DH/C/RF/1B Game 3, DH/RF/1B Game 4, DH/C/RF/1B Game 6, C/RF |
Game 7, C/RF |
Game 3, DH/C/RF/LF Game 6, C/RF |
Game 2, DH/RF/LF Game 5, DH/RF |
| Category | Value | Rank | Distance To Top | Number Tied | Distance To Bottom | Number Unranked |
|---|---|---|---|---|---|---|
| Appearances | 22 | 10th | 9 | 0 | 351 | 0 |
| Wins | 17 | 9th | 8 | 0 | 352 | 0 |
| Losses | 5 | 11th | 15 | 2 | 343 | 0 |
| Win Percent at RF (min 10 games) | 77.27% | 2nd | 2 | 0 | 17 | 341 |
| Fall '10 | Fall '11 | Winter '12 | Spring '12 |
|---|---|---|---|
|
Game 2, DH/C/RF/1B Game 3, DH/RF/1B Game 4, DH/C/RF/1B |
Game 3, DH/C/RF/LF |
Game 2, DH/RF/LF Game 5, DH/RF |
Game 1, DH Game 2, DH |
| Category | Value | Rank | Distance To Top | Number Tied | Distance To Bottom | Number Unranked |
|---|---|---|---|---|---|---|
| Appearances | 8 | 34th | 44 | 3 | 313 | 0 |
| Wins | 7 | 25th | 34 | 2 | 324 | 0 |
| Losses | 1 | 26th | 69 | 53 | 238 | 0 |
| Link | Size | Photographer | Description |
|---|---|---|---|
| jpg | 928K | Allen Pittman | Kelly B looks to the heavens before she bats in the top of the 5th inning (most likely watching a foul ball she hit being thrown back onto the field). |
| jpg | 907K | Allen Pittman | Kelly B swings the bat in the top of the 5th inning. The top of Azzy's head is visible at first base coach. |
| Link | Size | Photographer | Description |
|---|---|---|---|
| jpg | 837K | Allen Pittman | Becky hits a ball in the top of the 2nd inning. Neil is on deck, Matt is the third base coach, and Mitch is standing in the door of the dugout keeping score. In the dugout, from left to right, are Tim R, Michelle F, Newton, Azzy, Lindsay H, and Kelly B. On the other side of Mitch in the dugout, Lacey is sitting on the bench. |
| jpg | 906K | Allen Pittman | Becky at the plate in the top of the 2nd inning, looking back at the catcher and/or umpire. Neil is on deck. In the dugout from left to right are Lacey (sitting), Mitch (keeping score in the dugout door), Michelle F (sitting), Kelly B (walking toward the dugout door), Newton, Azzy, and Lindsay H (yellow socks). |
| jpg | 578K | Allen Pittman | Becky has hit a ball in the top of the 2nd inning. Neil is on deck and Matt is third base coach. From left to right in the dugout you can see Lacey (sitting), Mitch (in the dugout door), Michelle F (sitting, partially obscured by Becky's head), Lindsay H (sitting), Newton, Azzy, and Kelly B. Outside of the field near the light post you can see Tim R. |
| jpg | 3280K | Allen Pittman | Neil swings the bat in the top of the 2nd inning. Lacey is on deck and Matt is the third base coach. In the dugout from left to right are Mitch (in the doorway), Newton, Michelle F (sititng, partially obscured by Newton), Azzy, and Kelly B. |
| jpg | 1135K | Allen Pittman | Lacey hits a ball in the top of the 2nd inning. Newton is on deck. In the dugout from left to right are Tim R (barely visible sitting on the becnh between the bat rack and the door), Mitch (in the doorway with red cleats), Shawn W (in the doorway with white shirt), Becky (barely visible behind Lacey's head), Lindsay H (sitting with yellow socks), Azzy, and Kelly B. |
| jpg | 918K | Allen Pittman | Newton covers his head to protect himself from an errant throw as he runs to the plate in the top of the 2nd inning. Matt is on deck and Tim R is third base coach. In the dugout from left to right are Shawn W (white shirt, sitting), Neil (standing and drinking), Mitch (in the door of the dugout), Becky (only legs visible, obscured by Mitch), Kelly B (standing), and Michelle F (behind Kelly B). |
| jpg | 846K | Allen Pittman | Newton laughs and does a dance with the catcher as he prepares to cross the plate in the top of the 2nd inning. Tim R is third base coach. Kelly B (standing) and Michelle F (sitting) are partially visible in the dugout. |
| jpg | 591K | Allen Pittman | Lindsay H crosses the plate in the top of the 2nd inning. Kelly B is on deck and Tim R is third base coach. In the dugout, from left to right, are Shawn W (white shirt, sitting), Mitch (in the door keeping score), Azzy (standing), and Lacey (black shirt, standing). Neil is barely visible standing behind the dugout. |
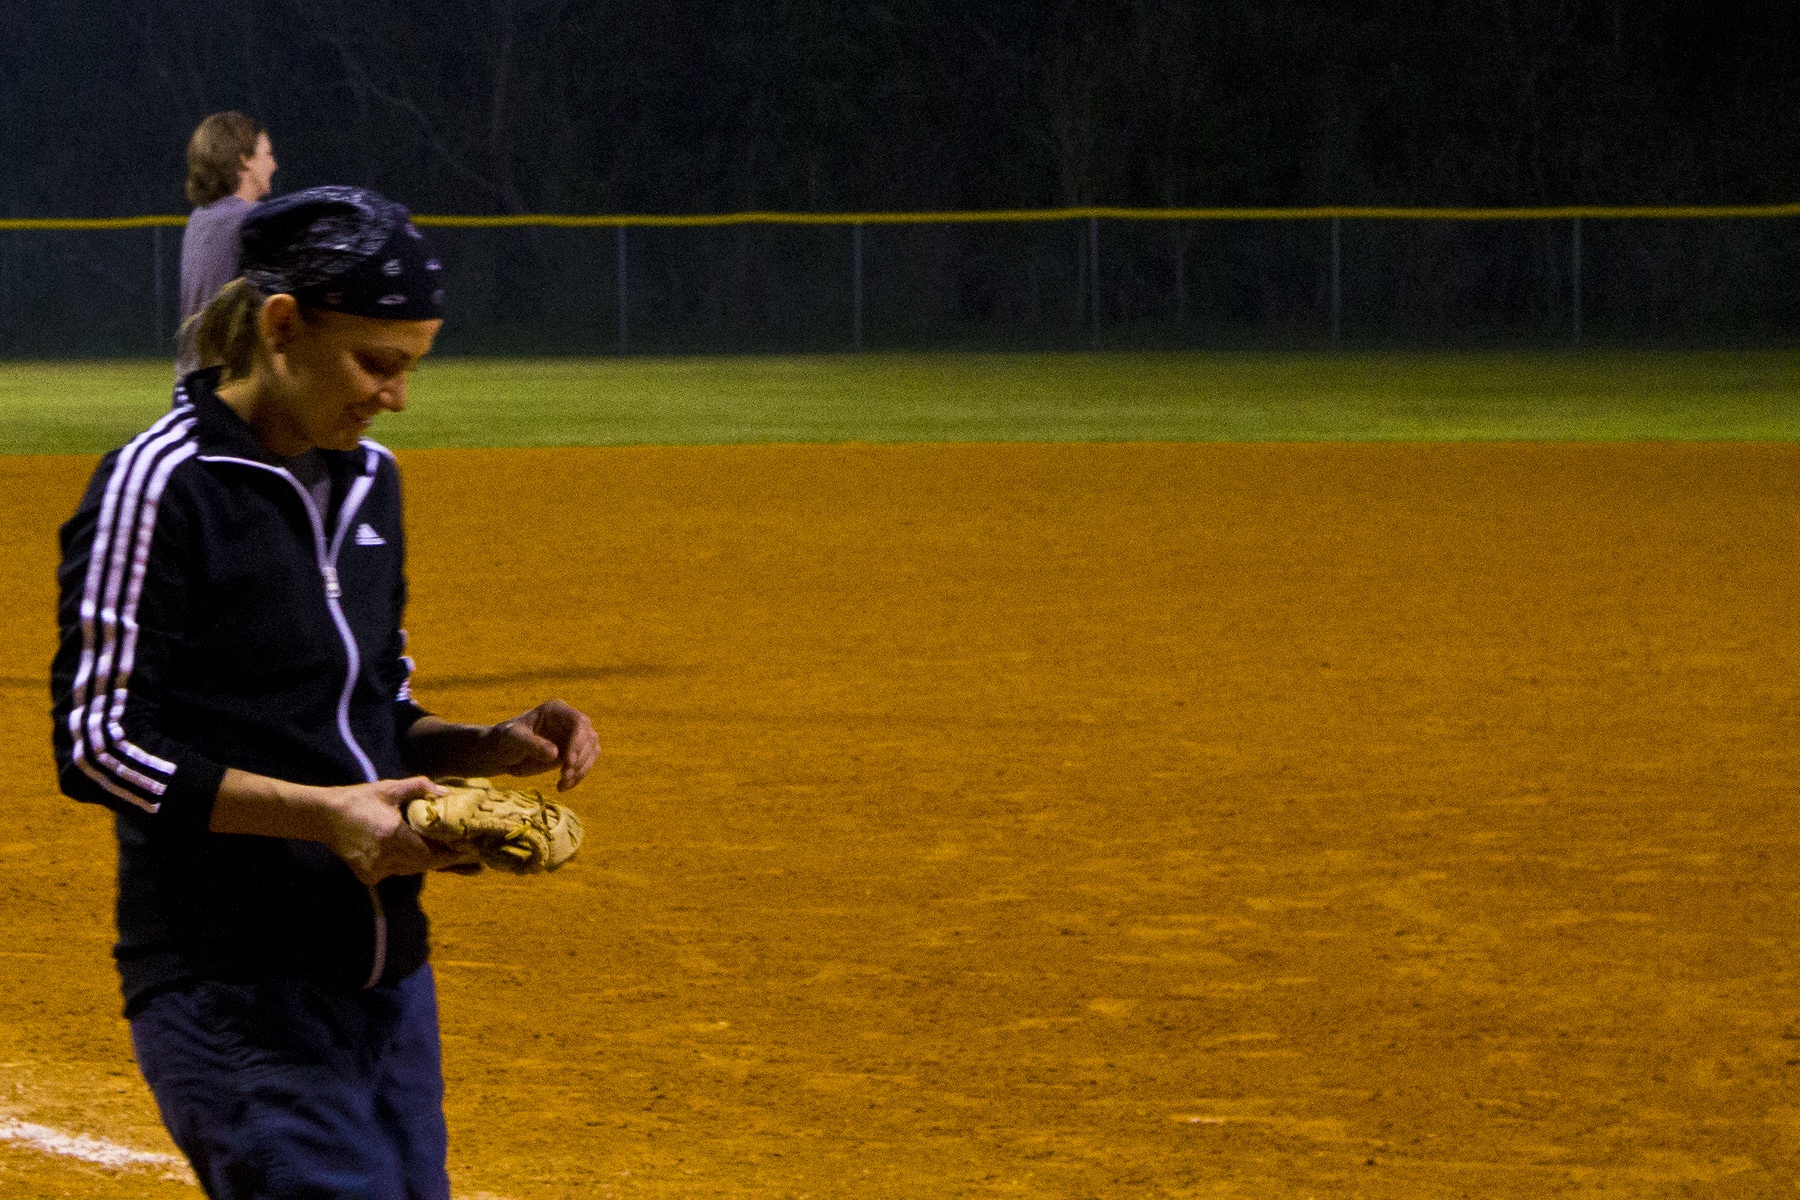
| jpg | 1112K | Allen Pittman | Lacey holds her glove and walks toward home plate to catch in the bottom of the 2nd inning. Kelly B is visible walking toward right field in the background. |