| G | PA | Actual PA | AB | R | H | 1B | 2B | 3B | HR | IHR | OHR | RBI | BB | RBB | ABB | Kc | Ks | SO | SF | RPA | OBP | ROBP | SLG | OPS | ROPS | AVG | ROE | FC | CI | GDP | GTP | AB/RSP | H/RSP | BA/RSP |
|---|---|---|---|---|---|---|---|---|---|---|---|---|---|---|---|---|---|---|---|---|---|---|---|---|---|---|---|---|---|---|---|---|---|---|
| 57 | 187 | 171 | 159 | 63 | 77 | 61 | 9 | 7 | 0 | 0 | 0 | 65 | 25 | 9 | 16 | 0 | 1 | 1 | 3 | 0.684 | 0.545 | 0.503 | 0.629 | 1.174 | 1.132 | 0.484 | 4 | 10 | 0 | 1 | 0 | 98 | 48 | 0.490 |
| PA | 1B | 2B | 3B | IHR | OHR | ABB | RBB | Kc | Ks | SF | ROE | FC | GDP | GTP | Other |
|---|---|---|---|---|---|---|---|---|---|---|---|---|---|---|---|
| 187 | 32.6% | 4.8% | 3.7% | 0.0% | 0.0% | 8.6% | 4.8% | 0.0% | 0.5% | 1.6% | 2.1% | 5.3% | 0.5% | 0.0% | 35.3% |
| Actual PA | 1B | 2B | 3B | IHR | OHR | RBB | Kc | Ks | SF | ROE | FC | GDP | GTP | Other |
|---|---|---|---|---|---|---|---|---|---|---|---|---|---|---|
| 171 | 35.7% | 5.3% | 4.1% | 0.0% | 0.0% | 5.3% | 0.0% | 0.6% | 1.8% | 2.3% | 5.8% | 0.6% | 0.0% | 38.6% |
| G | IP | BF | Actual BF | Balls | Strikes | PIT | Strike% | R | RA | ER | K | H | BB | RBB | ABB | FBB | MBB | IBB | SF | K/BB | HR | IHR | OHR | WHIP | OBP | ROBP | BAA |
|---|---|---|---|---|---|---|---|---|---|---|---|---|---|---|---|---|---|---|---|---|---|---|---|---|---|---|---|
| 2 | 5.6 | 49 | 46 | 42 | 66 | 108 | 61.1% | 20 | 3.529 | 16 | 0 | 19 | 10 | 7 | 3 | 6 | 3 | 0 | 0 | 0.000 | 1 | 1 | 0 | 5.118 | 0.592 | 0.565 | 0.487 |
| BF | K | ABB | RBB | IBB | SF | HR | non-HR H | Other |
|---|---|---|---|---|---|---|---|---|
| 49 | 0.0% | 6.1% | 14.3% | 0.0% | 0.0% | 2.0% | 36.7% | 40.8% |
| Actual BF | K | RBB | IBB | SF | HR | non-HR H | Other |
|---|---|---|---|---|---|---|---|
| 46 | 0.0% | 15.2% | 0.0% | 0.0% | 2.2% | 39.1% | 43.5% |
| YEAR | G | PA | Actual PA | AB | R | H | 1B | 2B | 3B | HR | IHR | OHR | RBI | BB | RBB | ABB | Kc | Ks | SO | SF | RPA | OBP | ROBP | SLG | OPS | ROPS | AVG | ROE | FC | CI | GDP | GTP | AB/RSP | H/RSP | BA/RSP |
|---|---|---|---|---|---|---|---|---|---|---|---|---|---|---|---|---|---|---|---|---|---|---|---|---|---|---|---|---|---|---|---|---|---|---|---|
| 2010 | 22 | 72 | 65 | 60 | 28 | 35 | 28 | 3 | 4 | 0 | 0 | 0 | 29 | 11 | 4 | 7 | 0 | 0 | 0 | 1 | 0.792 | 0.639 | 0.600 | 0.767 | 1.406 | 1.367 | 0.583 | 1 | 3 | 0 | 1 | 0 | 32 | 19 | 0.594 |
| 2011 | 18 | 60 | 57 | 53 | 14 | 17 | 14 | 2 | 1 | 0 | 0 | 0 | 11 | 6 | 3 | 3 | 0 | 1 | 1 | 1 | 0.417 | 0.383 | 0.351 | 0.396 | 0.780 | 0.747 | 0.321 | 2 | 6 | 0 | 0 | 0 | 34 | 11 | 0.324 |
| 2012 | 14 | 48 | 43 | 41 | 18 | 22 | 17 | 3 | 2 | 0 | 0 | 0 | 21 | 6 | 1 | 5 | 0 | 0 | 0 | 1 | 0.813 | 0.583 | 0.535 | 0.707 | 1.291 | 1.242 | 0.537 | 0 | 1 | 0 | 0 | 0 | 30 | 17 | 0.567 |
| 2013 | 2 | 6 | 5 | 4 | 3 | 3 | 2 | 1 | 0 | 0 | 0 | 0 | 4 | 2 | 1 | 1 | 0 | 0 | 0 | 0 | 1.167 | 0.833 | 0.800 | 1.000 | 1.833 | 1.800 | 0.750 | 1 | 0 | 0 | 0 | 0 | 2 | 1 | 0.500 |
| 2014 | 1 | 1 | 1 | 1 | 0 | 0 | 0 | 0 | 0 | 0 | 0 | 0 | 0 | 0 | 0 | 0 | 0 | 0 | 0 | 0 | 0.000 | 0.000 | 0.000 | 0.000 | 0.000 | 0.000 | 0.000 | 0 | 0 | 0 | 0 | 0 | 0 | 0 | 0.000 |
| TOTALS | 57 | 187 | 171 | 159 | 63 | 77 | 61 | 9 | 7 | 0 | 0 | 0 | 65 | 25 | 9 | 16 | 0 | 1 | 1 | 3 | 0.684 | 0.545 | 0.503 | 0.629 | 1.174 | 1.132 | 0.484 | 4 | 10 | 0 | 1 | 0 | 98 | 48 | 0.490 |
| YEAR | PA | 1B | 2B | 3B | IHR | OHR | ABB | RBB | Kc | Ks | SF | ROE | FC | GDP | GTP | Other |
|---|---|---|---|---|---|---|---|---|---|---|---|---|---|---|---|---|
| 2010 | 72 | 38.9% | 4.2% | 5.6% | 0.0% | 0.0% | 9.7% | 5.6% | 0.0% | 0.0% | 1.4% | 1.4% | 4.2% | 1.4% | 0.0% | 27.8% |
| 2011 | 60 | 23.3% | 3.3% | 1.7% | 0.0% | 0.0% | 5.0% | 5.0% | 0.0% | 1.7% | 1.7% | 3.3% | 10.0% | 0.0% | 0.0% | 45.0% |
| 2012 | 48 | 35.4% | 6.3% | 4.2% | 0.0% | 0.0% | 10.4% | 2.1% | 0.0% | 0.0% | 2.1% | 0.0% | 2.1% | 0.0% | 0.0% | 37.5% |
| 2013 | 6 | 33.3% | 16.7% | 0.0% | 0.0% | 0.0% | 16.7% | 16.7% | 0.0% | 0.0% | 0.0% | 16.7% | 0.0% | 0.0% | 0.0% | 0.0% |
| 2014 | 1 | 0.0% | 0.0% | 0.0% | 0.0% | 0.0% | 0.0% | 0.0% | 0.0% | 0.0% | 0.0% | 0.0% | 0.0% | 0.0% | 0.0% | 100.0% |
| TOTALS | 187 | 32.6% | 4.8% | 3.7% | 0.0% | 0.0% | 8.6% | 4.8% | 0.0% | 0.5% | 1.6% | 2.1% | 5.3% | 0.5% | 0.0% | 35.3% |
| YEAR | Actual PA | 1B | 2B | 3B | IHR | OHR | RBB | Kc | Ks | SF | ROE | FC | GDP | GTP | Other |
|---|---|---|---|---|---|---|---|---|---|---|---|---|---|---|---|
| 2010 | 65 | 43.1% | 4.6% | 6.2% | 0.0% | 0.0% | 6.2% | 0.0% | 0.0% | 1.5% | 1.5% | 4.6% | 1.5% | 0.0% | 30.8% |
| 2011 | 57 | 24.6% | 3.5% | 1.8% | 0.0% | 0.0% | 5.3% | 0.0% | 1.8% | 1.8% | 3.5% | 10.5% | 0.0% | 0.0% | 47.4% |
| 2012 | 43 | 39.5% | 7.0% | 4.7% | 0.0% | 0.0% | 2.3% | 0.0% | 0.0% | 2.3% | 0.0% | 2.3% | 0.0% | 0.0% | 41.9% |
| 2013 | 5 | 40.0% | 20.0% | 0.0% | 0.0% | 0.0% | 20.0% | 0.0% | 0.0% | 0.0% | 20.0% | 0.0% | 0.0% | 0.0% | 0.0% |
| 2014 | 1 | 0.0% | 0.0% | 0.0% | 0.0% | 0.0% | 0.0% | 0.0% | 0.0% | 0.0% | 0.0% | 0.0% | 0.0% | 0.0% | 100.0% |
| TOTALS | 171 | 35.7% | 5.3% | 4.1% | 0.0% | 0.0% | 5.3% | 0.0% | 0.6% | 1.8% | 2.3% | 5.8% | 0.6% | 0.0% | 38.6% |
| YEAR | G | IP | BF | Actual BF | Balls | Strikes | PIT | Strike% | R | RA | ER | K | H | BB | RBB | ABB | FBB | MBB | IBB | SF | K/BB | HR | IHR | OHR | WHIP | OBP | ROBP | BAA |
|---|---|---|---|---|---|---|---|---|---|---|---|---|---|---|---|---|---|---|---|---|---|---|---|---|---|---|---|---|
| 2010 | 1 | 4.6 | 35 | 32 | 34 | 47 | 81 | 58.0% | 10 | 2.143 | 10 | 0 | 11 | 9 | 6 | 3 | 5 | 3 | 0 | 0 | 0.000 | 0 | 0 | 0 | 4.286 | 0.571 | 0.531 | 0.423 |
| 2011 | 1 | 1.0 | 14 | 14 | 8 | 19 | 27 | 70.4% | 10 | 10.000 | 6 | 0 | 8 | 1 | 1 | 0 | 1 | 0 | 0 | 0 | 0.000 | 1 | 1 | 0 | 9.000 | 0.643 | 0.643 | 0.615 |
| TOTALS | 2 | 5.6 | 49 | 46 | 42 | 66 | 108 | 61.1% | 20 | 3.529 | 16 | 0 | 19 | 10 | 7 | 3 | 6 | 3 | 0 | 0 | 0.000 | 1 | 1 | 0 | 5.118 | 0.592 | 0.565 | 0.487 |
| YEAR | BF | K | ABB | RBB | IBB | SF | HR | non-HR H | Other |
|---|---|---|---|---|---|---|---|---|---|
| 2010 | 35 | 0.0% | 8.6% | 17.1% | 0.0% | 0.0% | 0.0% | 31.4% | 42.9% |
| 2011 | 14 | 0.0% | 0.0% | 7.1% | 0.0% | 0.0% | 7.1% | 50.0% | 35.7% |
| TOTALS | 49 | 0.0% | 6.1% | 14.3% | 0.0% | 0.0% | 2.0% | 36.7% | 40.8% |
| YEAR | Actual BF | K | RBB | IBB | SF | HR | non-HR H | Other |
|---|---|---|---|---|---|---|---|---|
| 2010 | 32 | 0.0% | 18.8% | 0.0% | 0.0% | 0.0% | 34.4% | 46.9% |
| 2011 | 14 | 0.0% | 7.1% | 0.0% | 0.0% | 7.1% | 50.0% | 35.7% |
| TOTALS | 46 | 0.0% | 15.2% | 0.0% | 0.0% | 2.2% | 39.1% | 43.5% |
| # | MONTH | G | PA | Actual PA | AB | R | H | 1B | 2B | 3B | HR | IHR | OHR | RBI | BB | RBB | ABB | Kc | Ks | SO | SF | RPA | OBP | ROBP | SLG | OPS | ROPS | AVG | ROE | FC | CI | GDP | GTP | AB/RSP | H/RSP | BA/RSP |
|---|---|---|---|---|---|---|---|---|---|---|---|---|---|---|---|---|---|---|---|---|---|---|---|---|---|---|---|---|---|---|---|---|---|---|---|---|
| 1 | Jan | 3 | 10 | 9 | 9 | 3 | 5 | 3 | 2 | 0 | 0 | 0 | 0 | 5 | 1 | 0 | 1 | 0 | 0 | 0 | 0 | 0.800 | 0.600 | 0.556 | 0.778 | 1.378 | 1.333 | 0.556 | 0 | 1 | 0 | 0 | 0 | 6 | 3 | 0.500 |
| 2 | Feb | 6 | 19 | 18 | 17 | 9 | 10 | 7 | 2 | 1 | 0 | 0 | 0 | 6 | 2 | 1 | 1 | 0 | 1 | 1 | 0 | 0.789 | 0.632 | 0.611 | 0.824 | 1.455 | 1.435 | 0.588 | 0 | 0 | 0 | 0 | 0 | 10 | 7 | 0.700 |
| 3 | Mar | 4 | 13 | 12 | 11 | 4 | 3 | 3 | 0 | 0 | 0 | 0 | 0 | 0 | 2 | 1 | 1 | 0 | 0 | 0 | 0 | 0.308 | 0.385 | 0.333 | 0.273 | 0.657 | 0.606 | 0.273 | 0 | 1 | 0 | 0 | 0 | 8 | 1 | 0.125 |
| 4 | Apr | 5 | 17 | 16 | 13 | 6 | 7 | 5 | 1 | 1 | 0 | 0 | 0 | 10 | 2 | 1 | 1 | 0 | 0 | 0 | 2 | 0.941 | 0.529 | 0.500 | 0.769 | 1.299 | 1.269 | 0.538 | 0 | 1 | 0 | 0 | 0 | 11 | 6 | 0.545 |
| 5 | May | 6 | 20 | 16 | 14 | 8 | 7 | 4 | 2 | 1 | 0 | 0 | 0 | 7 | 6 | 2 | 4 | 0 | 0 | 0 | 0 | 0.750 | 0.650 | 0.563 | 0.786 | 1.436 | 1.348 | 0.500 | 0 | 0 | 0 | 0 | 0 | 8 | 1 | 0.125 |
| 6 | Jun | 2 | 8 | 8 | 8 | 2 | 4 | 4 | 0 | 0 | 0 | 0 | 0 | 4 | 0 | 0 | 0 | 0 | 0 | 0 | 0 | 0.750 | 0.500 | 0.500 | 0.500 | 1.000 | 1.000 | 0.500 | 0 | 0 | 0 | 0 | 0 | 6 | 3 | 0.500 |
| 7 | Jul | 7 | 25 | 22 | 22 | 6 | 13 | 10 | 1 | 2 | 0 | 0 | 0 | 10 | 3 | 0 | 3 | 0 | 0 | 0 | 0 | 0.640 | 0.640 | 0.591 | 0.818 | 1.458 | 1.409 | 0.591 | 0 | 3 | 0 | 0 | 0 | 11 | 6 | 0.545 |
| 8 | Aug | 7 | 20 | 19 | 18 | 4 | 4 | 4 | 0 | 0 | 0 | 0 | 0 | 6 | 1 | 0 | 1 | 0 | 0 | 0 | 1 | 0.500 | 0.250 | 0.211 | 0.222 | 0.472 | 0.433 | 0.222 | 1 | 2 | 0 | 0 | 0 | 9 | 3 | 0.333 |
| 9 | Sep | 4 | 14 | 13 | 12 | 4 | 8 | 8 | 0 | 0 | 0 | 0 | 0 | 7 | 2 | 1 | 1 | 0 | 0 | 0 | 0 | 0.786 | 0.714 | 0.692 | 0.667 | 1.381 | 1.359 | 0.667 | 0 | 0 | 0 | 0 | 0 | 9 | 7 | 0.778 |
| 10 | Oct | 6 | 18 | 17 | 15 | 9 | 8 | 8 | 0 | 0 | 0 | 0 | 0 | 2 | 3 | 2 | 1 | 0 | 0 | 0 | 0 | 0.611 | 0.611 | 0.588 | 0.533 | 1.144 | 1.122 | 0.533 | 2 | 0 | 0 | 0 | 0 | 11 | 6 | 0.545 |
| 11 | Nov | 3 | 11 | 10 | 9 | 4 | 4 | 2 | 1 | 1 | 0 | 0 | 0 | 6 | 2 | 1 | 1 | 0 | 0 | 0 | 0 | 0.909 | 0.545 | 0.500 | 0.778 | 1.323 | 1.278 | 0.444 | 1 | 0 | 0 | 0 | 0 | 6 | 4 | 0.667 |
| 12 | Dec | 4 | 12 | 11 | 11 | 4 | 4 | 3 | 0 | 1 | 0 | 0 | 0 | 2 | 1 | 0 | 1 | 0 | 0 | 0 | 0 | 0.500 | 0.417 | 0.364 | 0.545 | 0.962 | 0.909 | 0.364 | 0 | 2 | 0 | 1 | 0 | 3 | 1 | 0.333 |
| TOTALS | 57 | 187 | 171 | 159 | 63 | 77 | 61 | 9 | 7 | 0 | 0 | 0 | 65 | 25 | 9 | 16 | 0 | 1 | 1 | 3 | 0.684 | 0.545 | 0.503 | 0.629 | 1.174 | 1.132 | 0.484 | 4 | 10 | 0 | 1 | 0 | 98 | 48 | 0.490 |
| # | MONTH | PA | 1B | 2B | 3B | IHR | OHR | ABB | RBB | Kc | Ks | SF | ROE | FC | GDP | GTP | Other |
|---|---|---|---|---|---|---|---|---|---|---|---|---|---|---|---|---|---|
| 1 | Jan | 10 | 30.0% | 20.0% | 0.0% | 0.0% | 0.0% | 10.0% | 0.0% | 0.0% | 0.0% | 0.0% | 0.0% | 10.0% | 0.0% | 0.0% | 30.0% |
| 2 | Feb | 19 | 36.8% | 10.5% | 5.3% | 0.0% | 0.0% | 5.3% | 5.3% | 0.0% | 5.3% | 0.0% | 0.0% | 0.0% | 0.0% | 0.0% | 31.6% |
| 3 | Mar | 13 | 23.1% | 0.0% | 0.0% | 0.0% | 0.0% | 7.7% | 7.7% | 0.0% | 0.0% | 0.0% | 0.0% | 7.7% | 0.0% | 0.0% | 53.8% |
| 4 | Apr | 17 | 29.4% | 5.9% | 5.9% | 0.0% | 0.0% | 5.9% | 5.9% | 0.0% | 0.0% | 11.8% | 0.0% | 5.9% | 0.0% | 0.0% | 29.4% |
| 5 | May | 20 | 20.0% | 10.0% | 5.0% | 0.0% | 0.0% | 20.0% | 10.0% | 0.0% | 0.0% | 0.0% | 0.0% | 0.0% | 0.0% | 0.0% | 35.0% |
| 6 | Jun | 8 | 50.0% | 0.0% | 0.0% | 0.0% | 0.0% | 0.0% | 0.0% | 0.0% | 0.0% | 0.0% | 0.0% | 0.0% | 0.0% | 0.0% | 50.0% |
| 7 | Jul | 25 | 40.0% | 4.0% | 8.0% | 0.0% | 0.0% | 12.0% | 0.0% | 0.0% | 0.0% | 0.0% | 0.0% | 12.0% | 0.0% | 0.0% | 24.0% |
| 8 | Aug | 20 | 20.0% | 0.0% | 0.0% | 0.0% | 0.0% | 5.0% | 0.0% | 0.0% | 0.0% | 5.0% | 5.0% | 10.0% | 0.0% | 0.0% | 55.0% |
| 9 | Sep | 14 | 57.1% | 0.0% | 0.0% | 0.0% | 0.0% | 7.1% | 7.1% | 0.0% | 0.0% | 0.0% | 0.0% | 0.0% | 0.0% | 0.0% | 28.6% |
| 10 | Oct | 18 | 44.4% | 0.0% | 0.0% | 0.0% | 0.0% | 5.6% | 11.1% | 0.0% | 0.0% | 0.0% | 11.1% | 0.0% | 0.0% | 0.0% | 27.8% |
| 11 | Nov | 11 | 18.2% | 9.1% | 9.1% | 0.0% | 0.0% | 9.1% | 9.1% | 0.0% | 0.0% | 0.0% | 9.1% | 0.0% | 0.0% | 0.0% | 36.4% |
| 12 | Dec | 12 | 25.0% | 0.0% | 8.3% | 0.0% | 0.0% | 8.3% | 0.0% | 0.0% | 0.0% | 0.0% | 0.0% | 16.7% | 8.3% | 0.0% | 33.3% |
| TOTALS | 187 | 32.6% | 4.8% | 3.7% | 0.0% | 0.0% | 8.6% | 4.8% | 0.0% | 0.5% | 1.6% | 2.1% | 5.3% | 0.5% | 0.0% | 35.3% |
| # | MONTH | Actual PA | 1B | 2B | 3B | IHR | OHR | RBB | Kc | Ks | SF | ROE | FC | GDP | GTP | Other |
|---|---|---|---|---|---|---|---|---|---|---|---|---|---|---|---|---|
| 1 | Jan | 9 | 33.3% | 22.2% | 0.0% | 0.0% | 0.0% | 0.0% | 0.0% | 0.0% | 0.0% | 0.0% | 11.1% | 0.0% | 0.0% | 33.3% |
| 2 | Feb | 18 | 38.9% | 11.1% | 5.6% | 0.0% | 0.0% | 5.6% | 0.0% | 5.6% | 0.0% | 0.0% | 0.0% | 0.0% | 0.0% | 33.3% |
| 3 | Mar | 12 | 25.0% | 0.0% | 0.0% | 0.0% | 0.0% | 8.3% | 0.0% | 0.0% | 0.0% | 0.0% | 8.3% | 0.0% | 0.0% | 58.3% |
| 4 | Apr | 16 | 31.3% | 6.3% | 6.3% | 0.0% | 0.0% | 6.3% | 0.0% | 0.0% | 12.5% | 0.0% | 6.3% | 0.0% | 0.0% | 31.3% |
| 5 | May | 16 | 25.0% | 12.5% | 6.3% | 0.0% | 0.0% | 12.5% | 0.0% | 0.0% | 0.0% | 0.0% | 0.0% | 0.0% | 0.0% | 43.8% |
| 6 | Jun | 8 | 50.0% | 0.0% | 0.0% | 0.0% | 0.0% | 0.0% | 0.0% | 0.0% | 0.0% | 0.0% | 0.0% | 0.0% | 0.0% | 50.0% |
| 7 | Jul | 22 | 45.5% | 4.5% | 9.1% | 0.0% | 0.0% | 0.0% | 0.0% | 0.0% | 0.0% | 0.0% | 13.6% | 0.0% | 0.0% | 27.3% |
| 8 | Aug | 19 | 21.1% | 0.0% | 0.0% | 0.0% | 0.0% | 0.0% | 0.0% | 0.0% | 5.3% | 5.3% | 10.5% | 0.0% | 0.0% | 57.9% |
| 9 | Sep | 13 | 61.5% | 0.0% | 0.0% | 0.0% | 0.0% | 7.7% | 0.0% | 0.0% | 0.0% | 0.0% | 0.0% | 0.0% | 0.0% | 30.8% |
| 10 | Oct | 17 | 47.1% | 0.0% | 0.0% | 0.0% | 0.0% | 11.8% | 0.0% | 0.0% | 0.0% | 11.8% | 0.0% | 0.0% | 0.0% | 29.4% |
| 11 | Nov | 10 | 20.0% | 10.0% | 10.0% | 0.0% | 0.0% | 10.0% | 0.0% | 0.0% | 0.0% | 10.0% | 0.0% | 0.0% | 0.0% | 40.0% |
| 12 | Dec | 11 | 27.3% | 0.0% | 9.1% | 0.0% | 0.0% | 0.0% | 0.0% | 0.0% | 0.0% | 0.0% | 18.2% | 9.1% | 0.0% | 36.4% |
| TOTALS | 171 | 35.7% | 5.3% | 4.1% | 0.0% | 0.0% | 5.3% | 0.0% | 0.6% | 1.8% | 2.3% | 5.8% | 0.6% | 0.0% | 38.6% |
| # | MONTH | G | IP | BF | Actual BF | Balls | Strikes | PIT | Strike% | R | RA | ER | K | H | BB | RBB | ABB | FBB | MBB | IBB | SF | K/BB | HR | IHR | OHR | WHIP | OBP | ROBP | BAA |
|---|---|---|---|---|---|---|---|---|---|---|---|---|---|---|---|---|---|---|---|---|---|---|---|---|---|---|---|---|---|
| 4 | Apr | 1 | 1.0 | 14 | 14 | 8 | 19 | 27 | 70.4% | 10 | 10.000 | 6 | 0 | 8 | 1 | 1 | 0 | 1 | 0 | 0 | 0 | 0.000 | 1 | 1 | 0 | 9.000 | 0.643 | 0.643 | 0.615 |
| 8 | Aug | 1 | 4.6 | 35 | 32 | 34 | 47 | 81 | 58.0% | 10 | 2.143 | 10 | 0 | 11 | 9 | 6 | 3 | 5 | 3 | 0 | 0 | 0.000 | 0 | 0 | 0 | 4.286 | 0.571 | 0.531 | 0.423 |
| TOTALS | 2 | 5.6 | 49 | 46 | 42 | 66 | 108 | 61.1% | 20 | 3.529 | 16 | 0 | 19 | 10 | 7 | 3 | 6 | 3 | 0 | 0 | 0.000 | 1 | 1 | 0 | 5.118 | 0.592 | 0.565 | 0.487 |
| # | MONTH | BF | K | ABB | RBB | IBB | SF | HR | non-HR H | Other |
|---|---|---|---|---|---|---|---|---|---|---|
| 4 | Apr | 14 | 0.0% | 0.0% | 7.1% | 0.0% | 0.0% | 7.1% | 50.0% | 35.7% |
| 8 | Aug | 35 | 0.0% | 8.6% | 17.1% | 0.0% | 0.0% | 0.0% | 31.4% | 42.9% |
| TOTALS | 49 | 0.0% | 6.1% | 14.3% | 0.0% | 0.0% | 2.0% | 36.7% | 40.8% |
| # | MONTH | Actual BF | K | RBB | IBB | SF | HR | non-HR H | Other |
|---|---|---|---|---|---|---|---|---|---|
| 4 | Apr | 14 | 0.0% | 7.1% | 0.0% | 0.0% | 7.1% | 50.0% | 35.7% |
| 8 | Aug | 32 | 0.0% | 18.8% | 0.0% | 0.0% | 0.0% | 34.4% | 46.9% |
| TOTALS | 46 | 0.0% | 15.2% | 0.0% | 0.0% | 2.2% | 39.1% | 43.5% |
| TIME | G | PA | Actual PA | AB | R | H | 1B | 2B | 3B | HR | IHR | OHR | RBI | BB | RBB | ABB | Kc | Ks | SO | SF | RPA | OBP | ROBP | SLG | OPS | ROPS | AVG | ROE | FC | CI | GDP | GTP | AB/RSP | H/RSP | BA/RSP |
|---|---|---|---|---|---|---|---|---|---|---|---|---|---|---|---|---|---|---|---|---|---|---|---|---|---|---|---|---|---|---|---|---|---|---|---|
| 6:30pm | 13 | 44 | 41 | 38 | 16 | 20 | 14 | 3 | 3 | 0 | 0 | 0 | 18 | 5 | 2 | 3 | 0 | 0 | 0 | 1 | 0.773 | 0.568 | 0.537 | 0.763 | 1.331 | 1.300 | 0.526 | 1 | 3 | 0 | 0 | 0 | 27 | 15 | 0.556 |
| 7:25pm | 13 | 41 | 38 | 34 | 15 | 15 | 9 | 5 | 1 | 0 | 0 | 0 | 16 | 7 | 4 | 3 | 0 | 0 | 0 | 0 | 0.756 | 0.537 | 0.500 | 0.647 | 1.184 | 1.147 | 0.441 | 1 | 2 | 0 | 0 | 0 | 22 | 9 | 0.409 |
| 8:20pm | 15 | 51 | 48 | 45 | 18 | 23 | 22 | 0 | 1 | 0 | 0 | 0 | 17 | 5 | 2 | 3 | 0 | 0 | 0 | 1 | 0.686 | 0.549 | 0.521 | 0.556 | 1.105 | 1.076 | 0.511 | 2 | 4 | 0 | 0 | 0 | 24 | 14 | 0.583 |
| 8:45pm | 1 | 4 | 3 | 3 | 2 | 3 | 2 | 1 | 0 | 0 | 0 | 0 | 3 | 1 | 0 | 1 | 0 | 0 | 0 | 0 | 1.250 | 1.000 | 1.000 | 1.333 | 2.333 | 2.333 | 1.000 | 0 | 0 | 0 | 0 | 0 | 1 | 1 | 1.000 |
| 9:15pm | 15 | 47 | 41 | 39 | 12 | 16 | 14 | 0 | 2 | 0 | 0 | 0 | 11 | 7 | 1 | 6 | 0 | 1 | 1 | 1 | 0.489 | 0.489 | 0.415 | 0.513 | 1.002 | 0.927 | 0.410 | 0 | 1 | 0 | 1 | 0 | 24 | 9 | 0.375 |
| TOTALS | 57 | 187 | 171 | 159 | 63 | 77 | 61 | 9 | 7 | 0 | 0 | 0 | 65 | 25 | 9 | 16 | 0 | 1 | 1 | 3 | 0.684 | 0.545 | 0.503 | 0.629 | 1.174 | 1.132 | 0.484 | 4 | 10 | 0 | 1 | 0 | 98 | 48 | 0.490 |
| TIME | PA | 1B | 2B | 3B | IHR | OHR | ABB | RBB | Kc | Ks | SF | ROE | FC | GDP | GTP | Other |
|---|---|---|---|---|---|---|---|---|---|---|---|---|---|---|---|---|
| 6:30pm | 44 | 31.8% | 6.8% | 6.8% | 0.0% | 0.0% | 6.8% | 4.5% | 0.0% | 0.0% | 2.3% | 2.3% | 6.8% | 0.0% | 0.0% | 31.8% |
| 7:25pm | 41 | 22.0% | 12.2% | 2.4% | 0.0% | 0.0% | 7.3% | 9.8% | 0.0% | 0.0% | 0.0% | 2.4% | 4.9% | 0.0% | 0.0% | 39.0% |
| 8:20pm | 51 | 43.1% | 0.0% | 2.0% | 0.0% | 0.0% | 5.9% | 3.9% | 0.0% | 0.0% | 2.0% | 3.9% | 7.8% | 0.0% | 0.0% | 31.4% |
| 8:45pm | 4 | 50.0% | 25.0% | 0.0% | 0.0% | 0.0% | 25.0% | 0.0% | 0.0% | 0.0% | 0.0% | 0.0% | 0.0% | 0.0% | 0.0% | 0.0% |
| 9:15pm | 47 | 29.8% | 0.0% | 4.3% | 0.0% | 0.0% | 12.8% | 2.1% | 0.0% | 2.1% | 2.1% | 0.0% | 2.1% | 2.1% | 0.0% | 42.6% |
| TOTALS | 187 | 32.6% | 4.8% | 3.7% | 0.0% | 0.0% | 8.6% | 4.8% | 0.0% | 0.5% | 1.6% | 2.1% | 5.3% | 0.5% | 0.0% | 35.3% |
| TIME | Actual PA | 1B | 2B | 3B | IHR | OHR | RBB | Kc | Ks | SF | ROE | FC | GDP | GTP | Other |
|---|---|---|---|---|---|---|---|---|---|---|---|---|---|---|---|
| 6:30pm | 41 | 34.1% | 7.3% | 7.3% | 0.0% | 0.0% | 4.9% | 0.0% | 0.0% | 2.4% | 2.4% | 7.3% | 0.0% | 0.0% | 34.1% |
| 7:25pm | 38 | 23.7% | 13.2% | 2.6% | 0.0% | 0.0% | 10.5% | 0.0% | 0.0% | 0.0% | 2.6% | 5.3% | 0.0% | 0.0% | 42.1% |
| 8:20pm | 48 | 45.8% | 0.0% | 2.1% | 0.0% | 0.0% | 4.2% | 0.0% | 0.0% | 2.1% | 4.2% | 8.3% | 0.0% | 0.0% | 33.3% |
| 8:45pm | 3 | 66.7% | 33.3% | 0.0% | 0.0% | 0.0% | 0.0% | 0.0% | 0.0% | 0.0% | 0.0% | 0.0% | 0.0% | 0.0% | 0.0% |
| 9:15pm | 41 | 34.1% | 0.0% | 4.9% | 0.0% | 0.0% | 2.4% | 0.0% | 2.4% | 2.4% | 0.0% | 2.4% | 2.4% | 0.0% | 48.8% |
| TOTALS | 171 | 35.7% | 5.3% | 4.1% | 0.0% | 0.0% | 5.3% | 0.0% | 0.6% | 1.8% | 2.3% | 5.8% | 0.6% | 0.0% | 38.6% |
| TIME | G | IP | BF | Actual BF | Balls | Strikes | PIT | Strike% | R | RA | ER | K | H | BB | RBB | ABB | FBB | MBB | IBB | SF | K/BB | HR | IHR | OHR | WHIP | OBP | ROBP | BAA |
|---|---|---|---|---|---|---|---|---|---|---|---|---|---|---|---|---|---|---|---|---|---|---|---|---|---|---|---|---|
| 7:25pm | 1 | 4.6 | 35 | 32 | 34 | 47 | 81 | 58.0% | 10 | 2.143 | 10 | 0 | 11 | 9 | 6 | 3 | 5 | 3 | 0 | 0 | 0.000 | 0 | 0 | 0 | 4.286 | 0.571 | 0.531 | 0.423 |
| 9:15pm | 1 | 1.0 | 14 | 14 | 8 | 19 | 27 | 70.4% | 10 | 10.000 | 6 | 0 | 8 | 1 | 1 | 0 | 1 | 0 | 0 | 0 | 0.000 | 1 | 1 | 0 | 9.000 | 0.643 | 0.643 | 0.615 |
| TOTALS | 2 | 5.6 | 49 | 46 | 42 | 66 | 108 | 61.1% | 20 | 3.529 | 16 | 0 | 19 | 10 | 7 | 3 | 6 | 3 | 0 | 0 | 0.000 | 1 | 1 | 0 | 5.118 | 0.592 | 0.565 | 0.487 |
| TIME | BF | K | ABB | RBB | IBB | SF | HR | non-HR H | Other |
|---|---|---|---|---|---|---|---|---|---|
| 7:25pm | 35 | 0.0% | 8.6% | 17.1% | 0.0% | 0.0% | 0.0% | 31.4% | 42.9% |
| 9:15pm | 14 | 0.0% | 0.0% | 7.1% | 0.0% | 0.0% | 7.1% | 50.0% | 35.7% |
| TOTALS | 49 | 0.0% | 6.1% | 14.3% | 0.0% | 0.0% | 2.0% | 36.7% | 40.8% |
| TIME | Actual BF | K | RBB | IBB | SF | HR | non-HR H | Other |
|---|---|---|---|---|---|---|---|---|
| 7:25pm | 32 | 0.0% | 18.8% | 0.0% | 0.0% | 0.0% | 34.4% | 46.9% |
| 9:15pm | 14 | 0.0% | 7.1% | 0.0% | 0.0% | 7.1% | 50.0% | 35.7% |
| TOTALS | 46 | 0.0% | 15.2% | 0.0% | 0.0% | 2.2% | 39.1% | 43.5% |
| # | SEASON | G | PA | Actual PA | AB | R | H | 1B | 2B | 3B | HR | IHR | OHR | RBI | BB | RBB | ABB | Kc | Ks | SO | SF | RPA | OBP | ROBP | SLG | OPS | ROPS | AVG | ROE | FC | CI | GDP | GTP | AB/RSP | H/RSP | BA/RSP |
|---|---|---|---|---|---|---|---|---|---|---|---|---|---|---|---|---|---|---|---|---|---|---|---|---|---|---|---|---|---|---|---|---|---|---|---|---|
| 53 | Spring II '10 | 5 | 16 | 14 | 11 | 9 | 7 | 3 | 2 | 2 | 0 | 0 | 0 | 9 | 5 | 3 | 2 | 0 | 0 | 0 | 0 | 1.125 | 0.750 | 0.714 | 1.182 | 1.932 | 1.896 | 0.636 | 0 | 0 | 0 | 0 | 0 | 7 | 3 | 0.429 |
| 54 | Summer I '10 | 4 | 14 | 11 | 11 | 4 | 9 | 7 | 1 | 1 | 0 | 0 | 0 | 8 | 3 | 0 | 3 | 0 | 0 | 0 | 0 | 0.857 | 0.857 | 0.818 | 1.091 | 1.948 | 1.909 | 0.818 | 0 | 0 | 0 | 0 | 0 | 5 | 4 | 0.800 |
| 55 | Summer II '10 | 6 | 20 | 19 | 18 | 4 | 8 | 8 | 0 | 0 | 0 | 0 | 0 | 6 | 1 | 0 | 1 | 0 | 0 | 0 | 1 | 0.500 | 0.450 | 0.421 | 0.444 | 0.894 | 0.865 | 0.444 | 1 | 1 | 0 | 0 | 0 | 10 | 6 | 0.600 |
| 56 | Fall '10 | 3 | 10 | 10 | 9 | 7 | 7 | 7 | 0 | 0 | 0 | 0 | 0 | 4 | 1 | 1 | 0 | 0 | 0 | 0 | 0 | 1.100 | 0.800 | 0.800 | 0.778 | 1.578 | 1.578 | 0.778 | 0 | 0 | 0 | 0 | 0 | 7 | 5 | 0.714 |
| 57 | Winter '10-'11 | 6 | 18 | 17 | 17 | 5 | 6 | 4 | 1 | 1 | 0 | 0 | 0 | 4 | 1 | 0 | 1 | 0 | 0 | 0 | 0 | 0.500 | 0.389 | 0.353 | 0.529 | 0.918 | 0.882 | 0.353 | 0 | 3 | 0 | 1 | 0 | 8 | 3 | 0.375 |
| 58 | Spring '11 | 5 | 16 | 15 | 14 | 4 | 3 | 3 | 0 | 0 | 0 | 0 | 0 | 0 | 2 | 1 | 1 | 0 | 1 | 1 | 0 | 0.250 | 0.313 | 0.267 | 0.214 | 0.527 | 0.481 | 0.214 | 0 | 1 | 0 | 0 | 0 | 9 | 0 | 0.000 |
| 59 | Summer I '11 | 1 | 3 | 3 | 2 | 1 | 2 | 2 | 0 | 0 | 0 | 0 | 0 | 2 | 0 | 0 | 0 | 0 | 0 | 0 | 1 | 1.000 | 0.667 | 0.667 | 1.000 | 1.667 | 1.667 | 1.000 | 0 | 0 | 0 | 0 | 0 | 1 | 1 | 1.000 |
| 60 | Summer II '11 | 6 | 21 | 20 | 20 | 3 | 6 | 5 | 0 | 1 | 0 | 0 | 0 | 6 | 1 | 0 | 1 | 0 | 0 | 0 | 0 | 0.429 | 0.333 | 0.300 | 0.400 | 0.733 | 0.700 | 0.300 | 0 | 4 | 0 | 0 | 0 | 12 | 4 | 0.333 |
| 61 | Fall '11 | 4 | 14 | 13 | 11 | 5 | 4 | 3 | 1 | 0 | 0 | 0 | 0 | 1 | 3 | 2 | 1 | 0 | 0 | 0 | 0 | 0.429 | 0.500 | 0.462 | 0.455 | 0.955 | 0.916 | 0.364 | 2 | 0 | 0 | 0 | 0 | 7 | 4 | 0.571 |
| 62 | Winter '12 | 5 | 16 | 15 | 14 | 9 | 10 | 7 | 2 | 1 | 0 | 0 | 0 | 6 | 2 | 1 | 1 | 0 | 0 | 0 | 0 | 0.938 | 0.750 | 0.733 | 1.000 | 1.750 | 1.733 | 0.714 | 0 | 0 | 0 | 0 | 0 | 9 | 8 | 0.889 |
| 63 | Spring '12 | 6 | 22 | 19 | 18 | 5 | 6 | 5 | 1 | 0 | 0 | 0 | 0 | 7 | 3 | 0 | 3 | 0 | 0 | 0 | 1 | 0.545 | 0.409 | 0.316 | 0.389 | 0.798 | 0.705 | 0.333 | 0 | 1 | 0 | 0 | 0 | 14 | 3 | 0.214 |
| 64 | Summer '12 | 1 | 4 | 4 | 4 | 2 | 3 | 3 | 0 | 0 | 0 | 0 | 0 | 3 | 0 | 0 | 0 | 0 | 0 | 0 | 0 | 1.250 | 0.750 | 0.750 | 0.750 | 1.500 | 1.500 | 0.750 | 0 | 0 | 0 | 0 | 0 | 3 | 3 | 1.000 |
| 65 | Fall '12 | 2 | 6 | 5 | 5 | 2 | 3 | 2 | 0 | 1 | 0 | 0 | 0 | 5 | 1 | 0 | 1 | 0 | 0 | 0 | 0 | 1.167 | 0.667 | 0.600 | 1.000 | 1.667 | 1.600 | 0.600 | 0 | 0 | 0 | 0 | 0 | 4 | 3 | 0.750 |
| 66 | Winter '12-'13 | 1 | 4 | 3 | 3 | 2 | 3 | 2 | 1 | 0 | 0 | 0 | 0 | 3 | 1 | 0 | 1 | 0 | 0 | 0 | 0 | 1.250 | 1.000 | 1.000 | 1.333 | 2.333 | 2.333 | 1.000 | 0 | 0 | 0 | 0 | 0 | 1 | 1 | 1.000 |
| 70 | Fall '13 | 1 | 2 | 2 | 1 | 1 | 0 | 0 | 0 | 0 | 0 | 0 | 0 | 1 | 1 | 1 | 0 | 0 | 0 | 0 | 0 | 1.000 | 0.500 | 0.500 | 0.000 | 0.500 | 0.500 | 0.000 | 1 | 0 | 0 | 0 | 0 | 1 | 0 | 0.000 |
| 74 | Summer II '14 | 1 | 1 | 1 | 1 | 0 | 0 | 0 | 0 | 0 | 0 | 0 | 0 | 0 | 0 | 0 | 0 | 0 | 0 | 0 | 0 | 0.000 | 0.000 | 0.000 | 0.000 | 0.000 | 0.000 | 0.000 | 0 | 0 | 0 | 0 | 0 | 0 | 0 | 0.000 |
| TOTALS | 57 | 187 | 171 | 159 | 63 | 77 | 61 | 9 | 7 | 0 | 0 | 0 | 65 | 25 | 9 | 16 | 0 | 1 | 1 | 3 | 0.684 | 0.545 | 0.503 | 0.629 | 1.174 | 1.132 | 0.484 | 4 | 10 | 0 | 1 | 0 | 98 | 48 | 0.490 |
| # | SEASON | PA | 1B | 2B | 3B | IHR | OHR | ABB | RBB | Kc | Ks | SF | ROE | FC | GDP | GTP | Other |
|---|---|---|---|---|---|---|---|---|---|---|---|---|---|---|---|---|---|
| 53 | Spring II '10 | 16 | 18.8% | 12.5% | 12.5% | 0.0% | 0.0% | 12.5% | 18.8% | 0.0% | 0.0% | 0.0% | 0.0% | 0.0% | 0.0% | 0.0% | 25.0% |
| 54 | Summer I '10 | 14 | 50.0% | 7.1% | 7.1% | 0.0% | 0.0% | 21.4% | 0.0% | 0.0% | 0.0% | 0.0% | 0.0% | 0.0% | 0.0% | 0.0% | 14.3% |
| 55 | Summer II '10 | 20 | 40.0% | 0.0% | 0.0% | 0.0% | 0.0% | 5.0% | 0.0% | 0.0% | 0.0% | 5.0% | 5.0% | 5.0% | 0.0% | 0.0% | 40.0% |
| 56 | Fall '10 | 10 | 70.0% | 0.0% | 0.0% | 0.0% | 0.0% | 0.0% | 10.0% | 0.0% | 0.0% | 0.0% | 0.0% | 0.0% | 0.0% | 0.0% | 20.0% |
| 57 | Winter '10-'11 | 18 | 22.2% | 5.6% | 5.6% | 0.0% | 0.0% | 5.6% | 0.0% | 0.0% | 0.0% | 0.0% | 0.0% | 16.7% | 5.6% | 0.0% | 38.9% |
| 58 | Spring '11 | 16 | 18.8% | 0.0% | 0.0% | 0.0% | 0.0% | 6.3% | 6.3% | 0.0% | 6.3% | 0.0% | 0.0% | 6.3% | 0.0% | 0.0% | 56.3% |
| 59 | Summer I '11 | 3 | 66.7% | 0.0% | 0.0% | 0.0% | 0.0% | 0.0% | 0.0% | 0.0% | 0.0% | 33.3% | 0.0% | 0.0% | 0.0% | 0.0% | 0.0% |
| 60 | Summer II '11 | 21 | 23.8% | 0.0% | 4.8% | 0.0% | 0.0% | 4.8% | 0.0% | 0.0% | 0.0% | 0.0% | 0.0% | 19.0% | 0.0% | 0.0% | 47.6% |
| 61 | Fall '11 | 14 | 21.4% | 7.1% | 0.0% | 0.0% | 0.0% | 7.1% | 14.3% | 0.0% | 0.0% | 0.0% | 14.3% | 0.0% | 0.0% | 0.0% | 35.7% |
| 62 | Winter '12 | 16 | 43.8% | 12.5% | 6.3% | 0.0% | 0.0% | 6.3% | 6.3% | 0.0% | 0.0% | 0.0% | 0.0% | 0.0% | 0.0% | 0.0% | 25.0% |
| 63 | Spring '12 | 22 | 22.7% | 4.5% | 0.0% | 0.0% | 0.0% | 13.6% | 0.0% | 0.0% | 0.0% | 4.5% | 0.0% | 4.5% | 0.0% | 0.0% | 50.0% |
| 64 | Summer '12 | 4 | 75.0% | 0.0% | 0.0% | 0.0% | 0.0% | 0.0% | 0.0% | 0.0% | 0.0% | 0.0% | 0.0% | 0.0% | 0.0% | 0.0% | 25.0% |
| 65 | Fall '12 | 6 | 33.3% | 0.0% | 16.7% | 0.0% | 0.0% | 16.7% | 0.0% | 0.0% | 0.0% | 0.0% | 0.0% | 0.0% | 0.0% | 0.0% | 33.3% |
| 66 | Winter '12-'13 | 4 | 50.0% | 25.0% | 0.0% | 0.0% | 0.0% | 25.0% | 0.0% | 0.0% | 0.0% | 0.0% | 0.0% | 0.0% | 0.0% | 0.0% | 0.0% |
| 70 | Fall '13 | 2 | 0.0% | 0.0% | 0.0% | 0.0% | 0.0% | 0.0% | 50.0% | 0.0% | 0.0% | 0.0% | 50.0% | 0.0% | 0.0% | 0.0% | 0.0% |
| 74 | Summer II '14 | 1 | 0.0% | 0.0% | 0.0% | 0.0% | 0.0% | 0.0% | 0.0% | 0.0% | 0.0% | 0.0% | 0.0% | 0.0% | 0.0% | 0.0% | 100.0% |
| TOTALS | 187 | 32.6% | 4.8% | 3.7% | 0.0% | 0.0% | 8.6% | 4.8% | 0.0% | 0.5% | 1.6% | 2.1% | 5.3% | 0.5% | 0.0% | 35.3% |
| # | SEASON | Actual PA | 1B | 2B | 3B | IHR | OHR | RBB | Kc | Ks | SF | ROE | FC | GDP | GTP | Other |
|---|---|---|---|---|---|---|---|---|---|---|---|---|---|---|---|---|
| 53 | Spring II '10 | 14 | 21.4% | 14.3% | 14.3% | 0.0% | 0.0% | 21.4% | 0.0% | 0.0% | 0.0% | 0.0% | 0.0% | 0.0% | 0.0% | 28.6% |
| 54 | Summer I '10 | 11 | 63.6% | 9.1% | 9.1% | 0.0% | 0.0% | 0.0% | 0.0% | 0.0% | 0.0% | 0.0% | 0.0% | 0.0% | 0.0% | 18.2% |
| 55 | Summer II '10 | 19 | 42.1% | 0.0% | 0.0% | 0.0% | 0.0% | 0.0% | 0.0% | 0.0% | 5.3% | 5.3% | 5.3% | 0.0% | 0.0% | 42.1% |
| 56 | Fall '10 | 10 | 70.0% | 0.0% | 0.0% | 0.0% | 0.0% | 10.0% | 0.0% | 0.0% | 0.0% | 0.0% | 0.0% | 0.0% | 0.0% | 20.0% |
| 57 | Winter '10-'11 | 17 | 23.5% | 5.9% | 5.9% | 0.0% | 0.0% | 0.0% | 0.0% | 0.0% | 0.0% | 0.0% | 17.6% | 5.9% | 0.0% | 41.2% |
| 58 | Spring '11 | 15 | 20.0% | 0.0% | 0.0% | 0.0% | 0.0% | 6.7% | 0.0% | 6.7% | 0.0% | 0.0% | 6.7% | 0.0% | 0.0% | 60.0% |
| 59 | Summer I '11 | 3 | 66.7% | 0.0% | 0.0% | 0.0% | 0.0% | 0.0% | 0.0% | 0.0% | 33.3% | 0.0% | 0.0% | 0.0% | 0.0% | 0.0% |
| 60 | Summer II '11 | 20 | 25.0% | 0.0% | 5.0% | 0.0% | 0.0% | 0.0% | 0.0% | 0.0% | 0.0% | 0.0% | 20.0% | 0.0% | 0.0% | 50.0% |
| 61 | Fall '11 | 13 | 23.1% | 7.7% | 0.0% | 0.0% | 0.0% | 15.4% | 0.0% | 0.0% | 0.0% | 15.4% | 0.0% | 0.0% | 0.0% | 38.5% |
| 62 | Winter '12 | 15 | 46.7% | 13.3% | 6.7% | 0.0% | 0.0% | 6.7% | 0.0% | 0.0% | 0.0% | 0.0% | 0.0% | 0.0% | 0.0% | 26.7% |
| 63 | Spring '12 | 19 | 26.3% | 5.3% | 0.0% | 0.0% | 0.0% | 0.0% | 0.0% | 0.0% | 5.3% | 0.0% | 5.3% | 0.0% | 0.0% | 57.9% |
| 64 | Summer '12 | 4 | 75.0% | 0.0% | 0.0% | 0.0% | 0.0% | 0.0% | 0.0% | 0.0% | 0.0% | 0.0% | 0.0% | 0.0% | 0.0% | 25.0% |
| 65 | Fall '12 | 5 | 40.0% | 0.0% | 20.0% | 0.0% | 0.0% | 0.0% | 0.0% | 0.0% | 0.0% | 0.0% | 0.0% | 0.0% | 0.0% | 40.0% |
| 66 | Winter '12-'13 | 3 | 66.7% | 33.3% | 0.0% | 0.0% | 0.0% | 0.0% | 0.0% | 0.0% | 0.0% | 0.0% | 0.0% | 0.0% | 0.0% | 0.0% |
| 70 | Fall '13 | 2 | 0.0% | 0.0% | 0.0% | 0.0% | 0.0% | 50.0% | 0.0% | 0.0% | 0.0% | 50.0% | 0.0% | 0.0% | 0.0% | 0.0% |
| 74 | Summer II '14 | 1 | 0.0% | 0.0% | 0.0% | 0.0% | 0.0% | 0.0% | 0.0% | 0.0% | 0.0% | 0.0% | 0.0% | 0.0% | 0.0% | 100.0% |
| TOTALS | 171 | 35.7% | 5.3% | 4.1% | 0.0% | 0.0% | 5.3% | 0.0% | 0.6% | 1.8% | 2.3% | 5.8% | 0.6% | 0.0% | 38.6% |
| # | SEASON | G | IP | BF | Actual BF | Balls | Strikes | PIT | Strike% | R | RA | ER | K | H | BB | RBB | ABB | FBB | MBB | IBB | SF | K/BB | HR | IHR | OHR | WHIP | OBP | ROBP | BAA |
|---|---|---|---|---|---|---|---|---|---|---|---|---|---|---|---|---|---|---|---|---|---|---|---|---|---|---|---|---|---|
| 55 | Summer II '10 | 1 | 4.6 | 35 | 32 | 34 | 47 | 81 | 58.0% | 10 | 2.143 | 10 | 0 | 11 | 9 | 6 | 3 | 5 | 3 | 0 | 0 | 0.000 | 0 | 0 | 0 | 4.286 | 0.571 | 0.531 | 0.423 |
| 59 | Summer I '11 | 1 | 1.0 | 14 | 14 | 8 | 19 | 27 | 70.4% | 10 | 10.000 | 6 | 0 | 8 | 1 | 1 | 0 | 1 | 0 | 0 | 0 | 0.000 | 1 | 1 | 0 | 9.000 | 0.643 | 0.643 | 0.615 |
| TOTALS | 2 | 5.6 | 49 | 46 | 42 | 66 | 108 | 61.1% | 20 | 3.529 | 16 | 0 | 19 | 10 | 7 | 3 | 6 | 3 | 0 | 0 | 0.000 | 1 | 1 | 0 | 5.118 | 0.592 | 0.565 | 0.487 |
| # | SEASON | BF | K | ABB | RBB | IBB | SF | HR | non-HR H | Other |
|---|---|---|---|---|---|---|---|---|---|---|
| 55 | Summer II '10 | 35 | 0.0% | 8.6% | 17.1% | 0.0% | 0.0% | 0.0% | 31.4% | 42.9% |
| 59 | Summer I '11 | 14 | 0.0% | 0.0% | 7.1% | 0.0% | 0.0% | 7.1% | 50.0% | 35.7% |
| TOTALS | 49 | 0.0% | 6.1% | 14.3% | 0.0% | 0.0% | 2.0% | 36.7% | 40.8% |
| # | SEASON | Actual BF | K | RBB | IBB | SF | HR | non-HR H | Other |
|---|---|---|---|---|---|---|---|---|---|
| 55 | Summer II '10 | 32 | 0.0% | 18.8% | 0.0% | 0.0% | 0.0% | 34.4% | 46.9% |
| 59 | Summer I '11 | 14 | 0.0% | 7.1% | 0.0% | 0.0% | 7.1% | 50.0% | 35.7% |
| TOTALS | 46 | 0.0% | 15.2% | 0.0% | 0.0% | 2.2% | 39.1% | 43.5% |
| OPPONENT | G | PA | Actual PA | AB | R | H | 1B | 2B | 3B | HR | IHR | OHR | RBI | BB | RBB | ABB | Kc | Ks | SO | SF | RPA | OBP | ROBP | SLG | OPS | ROPS | AVG | ROE | FC | CI | GDP | GTP | AB/RSP | H/RSP | BA/RSP |
|---|---|---|---|---|---|---|---|---|---|---|---|---|---|---|---|---|---|---|---|---|---|---|---|---|---|---|---|---|---|---|---|---|---|---|---|
| ACC | 3 | 9 | 9 | 9 | 1 | 3 | 3 | 0 | 0 | 0 | 0 | 0 | 0 | 0 | 0 | 0 | 0 | 0 | 0 | 0 | 0.111 | 0.333 | 0.333 | 0.333 | 0.667 | 0.667 | 0.333 | 0 | 1 | 0 | 1 | 0 | 4 | 1 | 0.250 |
| ATX Outlaws | 6 | 21 | 18 | 17 | 11 | 12 | 11 | 0 | 1 | 0 | 0 | 0 | 9 | 4 | 1 | 3 | 0 | 0 | 0 | 0 | 0.952 | 0.762 | 0.722 | 0.824 | 1.585 | 1.546 | 0.706 | 0 | 0 | 0 | 0 | 0 | 11 | 7 | 0.636 |
| Angels and Demons | 2 | 5 | 5 | 5 | 0 | 0 | 0 | 0 | 0 | 0 | 0 | 0 | 0 | 0 | 0 | 0 | 0 | 1 | 1 | 0 | 0.000 | 0.000 | 0.000 | 0.000 | 0.000 | 0.000 | 0.000 | 0 | 1 | 0 | 0 | 0 | 4 | 0 | 0.000 |
| Balls Deep | 1 | 3 | 2 | 2 | 2 | 2 | 0 | 1 | 1 | 0 | 0 | 0 | 4 | 1 | 0 | 1 | 0 | 0 | 0 | 0 | 2.000 | 1.000 | 1.000 | 2.500 | 3.500 | 3.500 | 1.000 | 0 | 0 | 0 | 0 | 0 | 1 | 1 | 1.000 |
| Beer Me | 1 | 3 | 3 | 2 | 1 | 2 | 2 | 0 | 0 | 0 | 0 | 0 | 2 | 0 | 0 | 0 | 0 | 0 | 0 | 1 | 1.000 | 0.667 | 0.667 | 1.000 | 1.667 | 1.667 | 1.000 | 0 | 0 | 0 | 0 | 0 | 1 | 1 | 1.000 |
| Bomb Squad | 1 | 3 | 3 | 3 | 1 | 1 | 0 | 0 | 1 | 0 | 0 | 0 | 3 | 0 | 0 | 0 | 0 | 0 | 0 | 0 | 1.333 | 0.333 | 0.333 | 1.000 | 1.333 | 1.333 | 0.333 | 0 | 0 | 0 | 0 | 0 | 2 | 1 | 0.500 |
| EoM | 3 | 9 | 8 | 7 | 5 | 4 | 2 | 1 | 1 | 0 | 0 | 0 | 6 | 2 | 1 | 1 | 0 | 0 | 0 | 0 | 1.222 | 0.667 | 0.625 | 1.000 | 1.667 | 1.625 | 0.571 | 0 | 0 | 0 | 0 | 0 | 6 | 3 | 0.500 |
| Gang Bangs One Out | 3 | 9 | 8 | 8 | 2 | 6 | 6 | 0 | 0 | 0 | 0 | 0 | 2 | 1 | 0 | 1 | 0 | 0 | 0 | 0 | 0.444 | 0.778 | 0.750 | 0.750 | 1.528 | 1.500 | 0.750 | 1 | 0 | 0 | 0 | 0 | 3 | 2 | 0.667 |
| Lonestars | 1 | 1 | 1 | 1 | 0 | 0 | 0 | 0 | 0 | 0 | 0 | 0 | 0 | 0 | 0 | 0 | 0 | 0 | 0 | 0 | 0.000 | 0.000 | 0.000 | 0.000 | 0.000 | 0.000 | 0.000 | 0 | 0 | 0 | 0 | 0 | 0 | 0 | 0.000 |
| Manifest | 1 | 3 | 2 | 2 | 1 | 2 | 2 | 0 | 0 | 0 | 0 | 0 | 2 | 1 | 0 | 1 | 0 | 0 | 0 | 0 | 1.000 | 1.000 | 1.000 | 1.000 | 2.000 | 2.000 | 1.000 | 0 | 0 | 0 | 0 | 0 | 2 | 2 | 1.000 |
| Oh Dangulatorz | 1 | 3 | 3 | 3 | 0 | 0 | 0 | 0 | 0 | 0 | 0 | 0 | 0 | 0 | 0 | 0 | 0 | 0 | 0 | 0 | 0.000 | 0.000 | 0.000 | 0.000 | 0.000 | 0.000 | 0.000 | 0 | 0 | 0 | 0 | 0 | 1 | 0 | 0.000 |
| Orange Crush | 5 | 18 | 17 | 14 | 4 | 7 | 6 | 1 | 0 | 0 | 0 | 0 | 7 | 3 | 2 | 1 | 0 | 0 | 0 | 1 | 0.611 | 0.556 | 0.529 | 0.571 | 1.127 | 1.101 | 0.500 | 0 | 2 | 0 | 0 | 0 | 10 | 5 | 0.500 |
| Pitch Slapped | 1 | 4 | 3 | 3 | 2 | 3 | 2 | 1 | 0 | 0 | 0 | 0 | 3 | 1 | 0 | 1 | 0 | 0 | 0 | 0 | 1.250 | 1.000 | 1.000 | 1.333 | 2.333 | 2.333 | 1.000 | 0 | 0 | 0 | 0 | 0 | 1 | 1 | 1.000 |
| Rita's Italian Ice | 2 | 6 | 5 | 4 | 3 | 3 | 2 | 1 | 0 | 0 | 0 | 0 | 2 | 2 | 1 | 1 | 0 | 0 | 0 | 0 | 0.833 | 0.833 | 0.800 | 1.000 | 1.833 | 1.800 | 0.750 | 0 | 0 | 0 | 0 | 0 | 3 | 3 | 1.000 |
| Shockers | 8 | 27 | 27 | 27 | 6 | 9 | 9 | 0 | 0 | 0 | 0 | 0 | 2 | 0 | 0 | 0 | 0 | 0 | 0 | 0 | 0.296 | 0.333 | 0.333 | 0.333 | 0.667 | 0.667 | 0.333 | 0 | 1 | 0 | 0 | 0 | 14 | 4 | 0.286 |
| Slow Moving Vehicles | 1 | 2 | 2 | 1 | 1 | 0 | 0 | 0 | 0 | 0 | 0 | 0 | 1 | 1 | 1 | 0 | 0 | 0 | 0 | 0 | 1.000 | 0.500 | 0.500 | 0.000 | 0.500 | 0.500 | 0.000 | 1 | 0 | 0 | 0 | 0 | 1 | 0 | 0.000 |
| Spinners | 2 | 8 | 7 | 5 | 4 | 1 | 0 | 1 | 0 | 0 | 0 | 0 | 1 | 3 | 2 | 1 | 0 | 0 | 0 | 0 | 0.625 | 0.500 | 0.429 | 0.400 | 0.900 | 0.829 | 0.200 | 2 | 0 | 0 | 0 | 0 | 3 | 1 | 0.333 |
| Sunni's Sinners | 2 | 7 | 7 | 7 | 2 | 3 | 3 | 0 | 0 | 0 | 0 | 0 | 3 | 0 | 0 | 0 | 0 | 0 | 0 | 0 | 0.714 | 0.429 | 0.429 | 0.429 | 0.857 | 0.857 | 0.429 | 0 | 2 | 0 | 0 | 0 | 6 | 2 | 0.333 |
| The Hangovers | 1 | 4 | 4 | 4 | 2 | 3 | 3 | 0 | 0 | 0 | 0 | 0 | 3 | 0 | 0 | 0 | 0 | 0 | 0 | 0 | 1.250 | 0.750 | 0.750 | 0.750 | 1.500 | 1.500 | 0.750 | 0 | 0 | 0 | 0 | 0 | 3 | 3 | 1.000 |
| The Outsiders | 2 | 8 | 8 | 7 | 2 | 3 | 3 | 0 | 0 | 0 | 0 | 0 | 3 | 0 | 0 | 0 | 0 | 0 | 0 | 1 | 0.625 | 0.375 | 0.375 | 0.429 | 0.804 | 0.804 | 0.429 | 0 | 0 | 0 | 0 | 0 | 4 | 3 | 0.750 |
| The Shockers | 2 | 7 | 7 | 7 | 5 | 5 | 3 | 1 | 1 | 0 | 0 | 0 | 3 | 0 | 0 | 0 | 0 | 0 | 0 | 0 | 1.143 | 0.714 | 0.714 | 1.143 | 1.857 | 1.857 | 0.714 | 0 | 0 | 0 | 0 | 0 | 5 | 4 | 0.800 |
| UFCU Orange Sox | 3 | 10 | 7 | 6 | 3 | 2 | 1 | 1 | 0 | 0 | 0 | 0 | 2 | 4 | 1 | 3 | 0 | 0 | 0 | 0 | 0.500 | 0.600 | 0.429 | 0.500 | 1.100 | 0.929 | 0.333 | 0 | 0 | 0 | 0 | 0 | 4 | 0 | 0.000 |
| Untouchaballs | 2 | 8 | 7 | 7 | 1 | 3 | 2 | 0 | 1 | 0 | 0 | 0 | 3 | 1 | 0 | 1 | 0 | 0 | 0 | 0 | 0.500 | 0.500 | 0.429 | 0.714 | 1.214 | 1.143 | 0.429 | 0 | 1 | 0 | 0 | 0 | 5 | 2 | 0.400 |
| WPSC | 3 | 9 | 8 | 8 | 4 | 3 | 1 | 1 | 1 | 0 | 0 | 0 | 4 | 1 | 0 | 1 | 0 | 0 | 0 | 0 | 0.889 | 0.444 | 0.375 | 0.750 | 1.194 | 1.125 | 0.375 | 0 | 2 | 0 | 0 | 0 | 4 | 2 | 0.500 |
| TOTALS | 57 | 187 | 171 | 159 | 63 | 77 | 61 | 9 | 7 | 0 | 0 | 0 | 65 | 25 | 9 | 16 | 0 | 1 | 1 | 3 | 0.684 | 0.545 | 0.503 | 0.629 | 1.174 | 1.132 | 0.484 | 4 | 10 | 0 | 1 | 0 | 98 | 48 | 0.490 |
| OPPONENT | PA | 1B | 2B | 3B | IHR | OHR | ABB | RBB | Kc | Ks | SF | ROE | FC | GDP | GTP | Other |
|---|---|---|---|---|---|---|---|---|---|---|---|---|---|---|---|---|
| ACC | 9 | 33.3% | 0.0% | 0.0% | 0.0% | 0.0% | 0.0% | 0.0% | 0.0% | 0.0% | 0.0% | 0.0% | 11.1% | 11.1% | 0.0% | 44.4% |
| ATX Outlaws | 21 | 52.4% | 0.0% | 4.8% | 0.0% | 0.0% | 14.3% | 4.8% | 0.0% | 0.0% | 0.0% | 0.0% | 0.0% | 0.0% | 0.0% | 23.8% |
| Angels and Demons | 5 | 0.0% | 0.0% | 0.0% | 0.0% | 0.0% | 0.0% | 0.0% | 0.0% | 20.0% | 0.0% | 0.0% | 20.0% | 0.0% | 0.0% | 60.0% |
| Balls Deep | 3 | 0.0% | 33.3% | 33.3% | 0.0% | 0.0% | 33.3% | 0.0% | 0.0% | 0.0% | 0.0% | 0.0% | 0.0% | 0.0% | 0.0% | 0.0% |
| Beer Me | 3 | 66.7% | 0.0% | 0.0% | 0.0% | 0.0% | 0.0% | 0.0% | 0.0% | 0.0% | 33.3% | 0.0% | 0.0% | 0.0% | 0.0% | 0.0% |
| Bomb Squad | 3 | 0.0% | 0.0% | 33.3% | 0.0% | 0.0% | 0.0% | 0.0% | 0.0% | 0.0% | 0.0% | 0.0% | 0.0% | 0.0% | 0.0% | 66.7% |
| EoM | 9 | 22.2% | 11.1% | 11.1% | 0.0% | 0.0% | 11.1% | 11.1% | 0.0% | 0.0% | 0.0% | 0.0% | 0.0% | 0.0% | 0.0% | 33.3% |
| Gang Bangs One Out | 9 | 66.7% | 0.0% | 0.0% | 0.0% | 0.0% | 11.1% | 0.0% | 0.0% | 0.0% | 0.0% | 11.1% | 0.0% | 0.0% | 0.0% | 11.1% |
| Lonestars | 1 | 0.0% | 0.0% | 0.0% | 0.0% | 0.0% | 0.0% | 0.0% | 0.0% | 0.0% | 0.0% | 0.0% | 0.0% | 0.0% | 0.0% | 100.0% |
| Manifest | 3 | 66.7% | 0.0% | 0.0% | 0.0% | 0.0% | 33.3% | 0.0% | 0.0% | 0.0% | 0.0% | 0.0% | 0.0% | 0.0% | 0.0% | 0.0% |
| Oh Dangulatorz | 3 | 0.0% | 0.0% | 0.0% | 0.0% | 0.0% | 0.0% | 0.0% | 0.0% | 0.0% | 0.0% | 0.0% | 0.0% | 0.0% | 0.0% | 100.0% |
| Orange Crush | 18 | 33.3% | 5.6% | 0.0% | 0.0% | 0.0% | 5.6% | 11.1% | 0.0% | 0.0% | 5.6% | 0.0% | 11.1% | 0.0% | 0.0% | 27.8% |
| Pitch Slapped | 4 | 50.0% | 25.0% | 0.0% | 0.0% | 0.0% | 25.0% | 0.0% | 0.0% | 0.0% | 0.0% | 0.0% | 0.0% | 0.0% | 0.0% | 0.0% |
| Rita's Italian Ice | 6 | 33.3% | 16.7% | 0.0% | 0.0% | 0.0% | 16.7% | 16.7% | 0.0% | 0.0% | 0.0% | 0.0% | 0.0% | 0.0% | 0.0% | 16.7% |
| Shockers | 27 | 33.3% | 0.0% | 0.0% | 0.0% | 0.0% | 0.0% | 0.0% | 0.0% | 0.0% | 0.0% | 0.0% | 3.7% | 0.0% | 0.0% | 63.0% |
| Slow Moving Vehicles | 2 | 0.0% | 0.0% | 0.0% | 0.0% | 0.0% | 0.0% | 50.0% | 0.0% | 0.0% | 0.0% | 50.0% | 0.0% | 0.0% | 0.0% | 0.0% |
| Spinners | 8 | 0.0% | 12.5% | 0.0% | 0.0% | 0.0% | 12.5% | 25.0% | 0.0% | 0.0% | 0.0% | 25.0% | 0.0% | 0.0% | 0.0% | 25.0% |
| Sunni's Sinners | 7 | 42.9% | 0.0% | 0.0% | 0.0% | 0.0% | 0.0% | 0.0% | 0.0% | 0.0% | 0.0% | 0.0% | 28.6% | 0.0% | 0.0% | 28.6% |
| The Hangovers | 4 | 75.0% | 0.0% | 0.0% | 0.0% | 0.0% | 0.0% | 0.0% | 0.0% | 0.0% | 0.0% | 0.0% | 0.0% | 0.0% | 0.0% | 25.0% |
| The Outsiders | 8 | 37.5% | 0.0% | 0.0% | 0.0% | 0.0% | 0.0% | 0.0% | 0.0% | 0.0% | 12.5% | 0.0% | 0.0% | 0.0% | 0.0% | 50.0% |
| The Shockers | 7 | 42.9% | 14.3% | 14.3% | 0.0% | 0.0% | 0.0% | 0.0% | 0.0% | 0.0% | 0.0% | 0.0% | 0.0% | 0.0% | 0.0% | 28.6% |
| UFCU Orange Sox | 10 | 10.0% | 10.0% | 0.0% | 0.0% | 0.0% | 30.0% | 10.0% | 0.0% | 0.0% | 0.0% | 0.0% | 0.0% | 0.0% | 0.0% | 40.0% |
| Untouchaballs | 8 | 25.0% | 0.0% | 12.5% | 0.0% | 0.0% | 12.5% | 0.0% | 0.0% | 0.0% | 0.0% | 0.0% | 12.5% | 0.0% | 0.0% | 37.5% |
| WPSC | 9 | 11.1% | 11.1% | 11.1% | 0.0% | 0.0% | 11.1% | 0.0% | 0.0% | 0.0% | 0.0% | 0.0% | 22.2% | 0.0% | 0.0% | 33.3% |
| TOTALS | 187 | 32.6% | 4.8% | 3.7% | 0.0% | 0.0% | 8.6% | 4.8% | 0.0% | 0.5% | 1.6% | 2.1% | 5.3% | 0.5% | 0.0% | 35.3% |
| OPPONENT | Actual PA | 1B | 2B | 3B | IHR | OHR | RBB | Kc | Ks | SF | ROE | FC | GDP | GTP | Other |
|---|---|---|---|---|---|---|---|---|---|---|---|---|---|---|---|
| ACC | 9 | 33.3% | 0.0% | 0.0% | 0.0% | 0.0% | 0.0% | 0.0% | 0.0% | 0.0% | 0.0% | 11.1% | 11.1% | 0.0% | 44.4% |
| ATX Outlaws | 18 | 61.1% | 0.0% | 5.6% | 0.0% | 0.0% | 5.6% | 0.0% | 0.0% | 0.0% | 0.0% | 0.0% | 0.0% | 0.0% | 27.8% |
| Angels and Demons | 5 | 0.0% | 0.0% | 0.0% | 0.0% | 0.0% | 0.0% | 0.0% | 20.0% | 0.0% | 0.0% | 20.0% | 0.0% | 0.0% | 60.0% |
| Balls Deep | 2 | 0.0% | 50.0% | 50.0% | 0.0% | 0.0% | 0.0% | 0.0% | 0.0% | 0.0% | 0.0% | 0.0% | 0.0% | 0.0% | 0.0% |
| Beer Me | 3 | 66.7% | 0.0% | 0.0% | 0.0% | 0.0% | 0.0% | 0.0% | 0.0% | 33.3% | 0.0% | 0.0% | 0.0% | 0.0% | 0.0% |
| Bomb Squad | 3 | 0.0% | 0.0% | 33.3% | 0.0% | 0.0% | 0.0% | 0.0% | 0.0% | 0.0% | 0.0% | 0.0% | 0.0% | 0.0% | 66.7% |
| EoM | 8 | 25.0% | 12.5% | 12.5% | 0.0% | 0.0% | 12.5% | 0.0% | 0.0% | 0.0% | 0.0% | 0.0% | 0.0% | 0.0% | 37.5% |
| Gang Bangs One Out | 8 | 75.0% | 0.0% | 0.0% | 0.0% | 0.0% | 0.0% | 0.0% | 0.0% | 0.0% | 12.5% | 0.0% | 0.0% | 0.0% | 12.5% |
| Lonestars | 1 | 0.0% | 0.0% | 0.0% | 0.0% | 0.0% | 0.0% | 0.0% | 0.0% | 0.0% | 0.0% | 0.0% | 0.0% | 0.0% | 100.0% |
| Manifest | 2 | 100.0% | 0.0% | 0.0% | 0.0% | 0.0% | 0.0% | 0.0% | 0.0% | 0.0% | 0.0% | 0.0% | 0.0% | 0.0% | 0.0% |
| Oh Dangulatorz | 3 | 0.0% | 0.0% | 0.0% | 0.0% | 0.0% | 0.0% | 0.0% | 0.0% | 0.0% | 0.0% | 0.0% | 0.0% | 0.0% | 100.0% |
| Orange Crush | 17 | 35.3% | 5.9% | 0.0% | 0.0% | 0.0% | 11.8% | 0.0% | 0.0% | 5.9% | 0.0% | 11.8% | 0.0% | 0.0% | 29.4% |
| Pitch Slapped | 3 | 66.7% | 33.3% | 0.0% | 0.0% | 0.0% | 0.0% | 0.0% | 0.0% | 0.0% | 0.0% | 0.0% | 0.0% | 0.0% | 0.0% |
| Rita's Italian Ice | 5 | 40.0% | 20.0% | 0.0% | 0.0% | 0.0% | 20.0% | 0.0% | 0.0% | 0.0% | 0.0% | 0.0% | 0.0% | 0.0% | 20.0% |
| Shockers | 27 | 33.3% | 0.0% | 0.0% | 0.0% | 0.0% | 0.0% | 0.0% | 0.0% | 0.0% | 0.0% | 3.7% | 0.0% | 0.0% | 63.0% |
| Slow Moving Vehicles | 2 | 0.0% | 0.0% | 0.0% | 0.0% | 0.0% | 50.0% | 0.0% | 0.0% | 0.0% | 50.0% | 0.0% | 0.0% | 0.0% | 0.0% |
| Spinners | 7 | 0.0% | 14.3% | 0.0% | 0.0% | 0.0% | 28.6% | 0.0% | 0.0% | 0.0% | 28.6% | 0.0% | 0.0% | 0.0% | 28.6% |
| Sunni's Sinners | 7 | 42.9% | 0.0% | 0.0% | 0.0% | 0.0% | 0.0% | 0.0% | 0.0% | 0.0% | 0.0% | 28.6% | 0.0% | 0.0% | 28.6% |
| The Hangovers | 4 | 75.0% | 0.0% | 0.0% | 0.0% | 0.0% | 0.0% | 0.0% | 0.0% | 0.0% | 0.0% | 0.0% | 0.0% | 0.0% | 25.0% |
| The Outsiders | 8 | 37.5% | 0.0% | 0.0% | 0.0% | 0.0% | 0.0% | 0.0% | 0.0% | 12.5% | 0.0% | 0.0% | 0.0% | 0.0% | 50.0% |
| The Shockers | 7 | 42.9% | 14.3% | 14.3% | 0.0% | 0.0% | 0.0% | 0.0% | 0.0% | 0.0% | 0.0% | 0.0% | 0.0% | 0.0% | 28.6% |
| UFCU Orange Sox | 7 | 14.3% | 14.3% | 0.0% | 0.0% | 0.0% | 14.3% | 0.0% | 0.0% | 0.0% | 0.0% | 0.0% | 0.0% | 0.0% | 57.1% |
| Untouchaballs | 7 | 28.6% | 0.0% | 14.3% | 0.0% | 0.0% | 0.0% | 0.0% | 0.0% | 0.0% | 0.0% | 14.3% | 0.0% | 0.0% | 42.9% |
| WPSC | 8 | 12.5% | 12.5% | 12.5% | 0.0% | 0.0% | 0.0% | 0.0% | 0.0% | 0.0% | 0.0% | 25.0% | 0.0% | 0.0% | 37.5% |
| TOTALS | 171 | 35.7% | 5.3% | 4.1% | 0.0% | 0.0% | 5.3% | 0.0% | 0.6% | 1.8% | 2.3% | 5.8% | 0.6% | 0.0% | 38.6% |
| OPPONENT | G | IP | BF | Actual BF | Balls | Strikes | PIT | Strike% | R | RA | ER | K | H | BB | RBB | ABB | FBB | MBB | IBB | SF | K/BB | HR | IHR | OHR | WHIP | OBP | ROBP | BAA |
|---|---|---|---|---|---|---|---|---|---|---|---|---|---|---|---|---|---|---|---|---|---|---|---|---|---|---|---|---|
| Beer Me | 1 | 1.0 | 14 | 14 | 8 | 19 | 27 | 70.4% | 10 | 10.000 | 6 | 0 | 8 | 1 | 1 | 0 | 1 | 0 | 0 | 0 | 0.000 | 1 | 1 | 0 | 9.000 | 0.643 | 0.643 | 0.615 |
| Orange Crush | 1 | 4.6 | 35 | 32 | 34 | 47 | 81 | 58.0% | 10 | 2.143 | 10 | 0 | 11 | 9 | 6 | 3 | 5 | 3 | 0 | 0 | 0.000 | 0 | 0 | 0 | 4.286 | 0.571 | 0.531 | 0.423 |
| TOTALS | 2 | 5.6 | 49 | 46 | 42 | 66 | 108 | 61.1% | 20 | 3.529 | 16 | 0 | 19 | 10 | 7 | 3 | 6 | 3 | 0 | 0 | 0.000 | 1 | 1 | 0 | 5.118 | 0.592 | 0.565 | 0.487 |
| OPPONENT | BF | K | ABB | RBB | IBB | SF | HR | non-HR H | Other |
|---|---|---|---|---|---|---|---|---|---|
| Beer Me | 14 | 0.0% | 0.0% | 7.1% | 0.0% | 0.0% | 7.1% | 50.0% | 35.7% |
| Orange Crush | 35 | 0.0% | 8.6% | 17.1% | 0.0% | 0.0% | 0.0% | 31.4% | 42.9% |
| TOTALS | 49 | 0.0% | 6.1% | 14.3% | 0.0% | 0.0% | 2.0% | 36.7% | 40.8% |
| OPPONENT | Actual BF | K | RBB | IBB | SF | HR | non-HR H | Other |
|---|---|---|---|---|---|---|---|---|
| Beer Me | 14 | 0.0% | 7.1% | 0.0% | 0.0% | 7.1% | 50.0% | 35.7% |
| Orange Crush | 32 | 0.0% | 18.8% | 0.0% | 0.0% | 0.0% | 34.4% | 46.9% |
| TOTALS | 46 | 0.0% | 15.2% | 0.0% | 0.0% | 2.2% | 39.1% | 43.5% |
| FIELD | G | PA | Actual PA | AB | R | H | 1B | 2B | 3B | HR | IHR | OHR | RBI | BB | RBB | ABB | Kc | Ks | SO | SF | RPA | OBP | ROBP | SLG | OPS | ROPS | AVG | ROE | FC | CI | GDP | GTP | AB/RSP | H/RSP | BA/RSP |
|---|---|---|---|---|---|---|---|---|---|---|---|---|---|---|---|---|---|---|---|---|---|---|---|---|---|---|---|---|---|---|---|---|---|---|---|
| Butler 1 | 1 | 4 | 3 | 3 | 2 | 3 | 2 | 1 | 0 | 0 | 0 | 0 | 3 | 1 | 0 | 1 | 0 | 0 | 0 | 0 | 1.250 | 1.000 | 1.000 | 1.333 | 2.333 | 2.333 | 1.000 | 0 | 0 | 0 | 0 | 0 | 1 | 1 | 1.000 |
| Havins 1 | 14 | 45 | 41 | 38 | 14 | 16 | 12 | 3 | 1 | 0 | 0 | 0 | 10 | 7 | 3 | 4 | 0 | 1 | 1 | 0 | 0.533 | 0.511 | 0.463 | 0.553 | 1.064 | 1.016 | 0.421 | 1 | 2 | 0 | 0 | 0 | 26 | 10 | 0.385 |
| Havins 2 | 14 | 46 | 44 | 42 | 16 | 25 | 20 | 3 | 2 | 0 | 0 | 0 | 20 | 4 | 2 | 2 | 0 | 0 | 0 | 0 | 0.783 | 0.630 | 0.614 | 0.762 | 1.392 | 1.376 | 0.595 | 0 | 3 | 0 | 0 | 0 | 25 | 16 | 0.640 |
| Havins 3 | 7 | 25 | 23 | 21 | 10 | 10 | 7 | 0 | 3 | 0 | 0 | 0 | 10 | 2 | 0 | 2 | 0 | 0 | 0 | 2 | 0.800 | 0.480 | 0.435 | 0.762 | 1.242 | 1.197 | 0.476 | 0 | 4 | 0 | 1 | 0 | 11 | 6 | 0.545 |
| Havins 4 | 7 | 24 | 23 | 19 | 9 | 9 | 7 | 2 | 0 | 0 | 0 | 0 | 8 | 4 | 3 | 1 | 0 | 0 | 0 | 1 | 0.708 | 0.542 | 0.522 | 0.579 | 1.121 | 1.101 | 0.474 | 2 | 0 | 0 | 0 | 0 | 11 | 6 | 0.545 |
| Havins 5 | 9 | 30 | 25 | 25 | 7 | 8 | 8 | 0 | 0 | 0 | 0 | 0 | 5 | 5 | 0 | 5 | 0 | 0 | 0 | 0 | 0.400 | 0.433 | 0.320 | 0.320 | 0.753 | 0.640 | 0.320 | 0 | 1 | 0 | 0 | 0 | 16 | 3 | 0.188 |
| Krieg 2 | 1 | 1 | 1 | 1 | 0 | 0 | 0 | 0 | 0 | 0 | 0 | 0 | 0 | 0 | 0 | 0 | 0 | 0 | 0 | 0 | 0.000 | 0.000 | 0.000 | 0.000 | 0.000 | 0.000 | 0.000 | 0 | 0 | 0 | 0 | 0 | 0 | 0 | 0.000 |
| Krieg 4 | 1 | 3 | 2 | 2 | 1 | 2 | 2 | 0 | 0 | 0 | 0 | 0 | 2 | 1 | 0 | 1 | 0 | 0 | 0 | 0 | 1.000 | 1.000 | 1.000 | 1.000 | 2.000 | 2.000 | 1.000 | 0 | 0 | 0 | 0 | 0 | 2 | 2 | 1.000 |
| Krieg 5 | 1 | 2 | 2 | 1 | 1 | 0 | 0 | 0 | 0 | 0 | 0 | 0 | 1 | 1 | 1 | 0 | 0 | 0 | 0 | 0 | 1.000 | 0.500 | 0.500 | 0.000 | 0.500 | 0.500 | 0.000 | 1 | 0 | 0 | 0 | 0 | 1 | 0 | 0.000 |
| Krieg 6 | 1 | 3 | 3 | 3 | 1 | 1 | 0 | 0 | 1 | 0 | 0 | 0 | 3 | 0 | 0 | 0 | 0 | 0 | 0 | 0 | 1.333 | 0.333 | 0.333 | 1.000 | 1.333 | 1.333 | 0.333 | 0 | 0 | 0 | 0 | 0 | 2 | 1 | 0.500 |
| Krieg 11 | 1 | 4 | 4 | 4 | 2 | 3 | 3 | 0 | 0 | 0 | 0 | 0 | 3 | 0 | 0 | 0 | 0 | 0 | 0 | 0 | 1.250 | 0.750 | 0.750 | 0.750 | 1.500 | 1.500 | 0.750 | 0 | 0 | 0 | 0 | 0 | 3 | 3 | 1.000 |
| TOTALS | 57 | 187 | 171 | 159 | 63 | 77 | 61 | 9 | 7 | 0 | 0 | 0 | 65 | 25 | 9 | 16 | 0 | 1 | 1 | 3 | 0.684 | 0.545 | 0.503 | 0.629 | 1.174 | 1.132 | 0.484 | 4 | 10 | 0 | 1 | 0 | 98 | 48 | 0.490 |
| FIELD | PA | 1B | 2B | 3B | IHR | OHR | ABB | RBB | Kc | Ks | SF | ROE | FC | GDP | GTP | Other |
|---|---|---|---|---|---|---|---|---|---|---|---|---|---|---|---|---|
| Butler 1 | 4 | 50.0% | 25.0% | 0.0% | 0.0% | 0.0% | 25.0% | 0.0% | 0.0% | 0.0% | 0.0% | 0.0% | 0.0% | 0.0% | 0.0% | 0.0% |
| Havins 1 | 45 | 26.7% | 6.7% | 2.2% | 0.0% | 0.0% | 8.9% | 6.7% | 0.0% | 2.2% | 0.0% | 2.2% | 4.4% | 0.0% | 0.0% | 40.0% |
| Havins 2 | 46 | 43.5% | 6.5% | 4.3% | 0.0% | 0.0% | 4.3% | 4.3% | 0.0% | 0.0% | 0.0% | 0.0% | 6.5% | 0.0% | 0.0% | 30.4% |
| Havins 3 | 25 | 28.0% | 0.0% | 12.0% | 0.0% | 0.0% | 8.0% | 0.0% | 0.0% | 0.0% | 8.0% | 0.0% | 16.0% | 4.0% | 0.0% | 24.0% |
| Havins 4 | 24 | 29.2% | 8.3% | 0.0% | 0.0% | 0.0% | 4.2% | 12.5% | 0.0% | 0.0% | 4.2% | 8.3% | 0.0% | 0.0% | 0.0% | 33.3% |
| Havins 5 | 30 | 26.7% | 0.0% | 0.0% | 0.0% | 0.0% | 16.7% | 0.0% | 0.0% | 0.0% | 0.0% | 0.0% | 3.3% | 0.0% | 0.0% | 53.3% |
| Krieg 2 | 1 | 0.0% | 0.0% | 0.0% | 0.0% | 0.0% | 0.0% | 0.0% | 0.0% | 0.0% | 0.0% | 0.0% | 0.0% | 0.0% | 0.0% | 100.0% |
| Krieg 4 | 3 | 66.7% | 0.0% | 0.0% | 0.0% | 0.0% | 33.3% | 0.0% | 0.0% | 0.0% | 0.0% | 0.0% | 0.0% | 0.0% | 0.0% | 0.0% |
| Krieg 5 | 2 | 0.0% | 0.0% | 0.0% | 0.0% | 0.0% | 0.0% | 50.0% | 0.0% | 0.0% | 0.0% | 50.0% | 0.0% | 0.0% | 0.0% | 0.0% |
| Krieg 6 | 3 | 0.0% | 0.0% | 33.3% | 0.0% | 0.0% | 0.0% | 0.0% | 0.0% | 0.0% | 0.0% | 0.0% | 0.0% | 0.0% | 0.0% | 66.7% |
| Krieg 11 | 4 | 75.0% | 0.0% | 0.0% | 0.0% | 0.0% | 0.0% | 0.0% | 0.0% | 0.0% | 0.0% | 0.0% | 0.0% | 0.0% | 0.0% | 25.0% |
| TOTALS | 187 | 32.6% | 4.8% | 3.7% | 0.0% | 0.0% | 8.6% | 4.8% | 0.0% | 0.5% | 1.6% | 2.1% | 5.3% | 0.5% | 0.0% | 35.3% |
| FIELD | Actual PA | 1B | 2B | 3B | IHR | OHR | RBB | Kc | Ks | SF | ROE | FC | GDP | GTP | Other |
|---|---|---|---|---|---|---|---|---|---|---|---|---|---|---|---|
| Butler 1 | 3 | 66.7% | 33.3% | 0.0% | 0.0% | 0.0% | 0.0% | 0.0% | 0.0% | 0.0% | 0.0% | 0.0% | 0.0% | 0.0% | 0.0% |
| Havins 1 | 41 | 29.3% | 7.3% | 2.4% | 0.0% | 0.0% | 7.3% | 0.0% | 2.4% | 0.0% | 2.4% | 4.9% | 0.0% | 0.0% | 43.9% |
| Havins 2 | 44 | 45.5% | 6.8% | 4.5% | 0.0% | 0.0% | 4.5% | 0.0% | 0.0% | 0.0% | 0.0% | 6.8% | 0.0% | 0.0% | 31.8% |
| Havins 3 | 23 | 30.4% | 0.0% | 13.0% | 0.0% | 0.0% | 0.0% | 0.0% | 0.0% | 8.7% | 0.0% | 17.4% | 4.3% | 0.0% | 26.1% |
| Havins 4 | 23 | 30.4% | 8.7% | 0.0% | 0.0% | 0.0% | 13.0% | 0.0% | 0.0% | 4.3% | 8.7% | 0.0% | 0.0% | 0.0% | 34.8% |
| Havins 5 | 25 | 32.0% | 0.0% | 0.0% | 0.0% | 0.0% | 0.0% | 0.0% | 0.0% | 0.0% | 0.0% | 4.0% | 0.0% | 0.0% | 64.0% |
| Krieg 2 | 1 | 0.0% | 0.0% | 0.0% | 0.0% | 0.0% | 0.0% | 0.0% | 0.0% | 0.0% | 0.0% | 0.0% | 0.0% | 0.0% | 100.0% |
| Krieg 4 | 2 | 100.0% | 0.0% | 0.0% | 0.0% | 0.0% | 0.0% | 0.0% | 0.0% | 0.0% | 0.0% | 0.0% | 0.0% | 0.0% | 0.0% |
| Krieg 5 | 2 | 0.0% | 0.0% | 0.0% | 0.0% | 0.0% | 50.0% | 0.0% | 0.0% | 0.0% | 50.0% | 0.0% | 0.0% | 0.0% | 0.0% |
| Krieg 6 | 3 | 0.0% | 0.0% | 33.3% | 0.0% | 0.0% | 0.0% | 0.0% | 0.0% | 0.0% | 0.0% | 0.0% | 0.0% | 0.0% | 66.7% |
| Krieg 11 | 4 | 75.0% | 0.0% | 0.0% | 0.0% | 0.0% | 0.0% | 0.0% | 0.0% | 0.0% | 0.0% | 0.0% | 0.0% | 0.0% | 25.0% |
| TOTALS | 171 | 35.7% | 5.3% | 4.1% | 0.0% | 0.0% | 5.3% | 0.0% | 0.6% | 1.8% | 2.3% | 5.8% | 0.6% | 0.0% | 38.6% |
| FIELD | G | IP | BF | Actual BF | Balls | Strikes | PIT | Strike% | R | RA | ER | K | H | BB | RBB | ABB | FBB | MBB | IBB | SF | K/BB | HR | IHR | OHR | WHIP | OBP | ROBP | BAA |
|---|---|---|---|---|---|---|---|---|---|---|---|---|---|---|---|---|---|---|---|---|---|---|---|---|---|---|---|---|
| Havins 2 | 1 | 4.6 | 35 | 32 | 34 | 47 | 81 | 58.0% | 10 | 2.143 | 10 | 0 | 11 | 9 | 6 | 3 | 5 | 3 | 0 | 0 | 0.000 | 0 | 0 | 0 | 4.286 | 0.571 | 0.531 | 0.423 |
| Havins 4 | 1 | 1.0 | 14 | 14 | 8 | 19 | 27 | 70.4% | 10 | 10.000 | 6 | 0 | 8 | 1 | 1 | 0 | 1 | 0 | 0 | 0 | 0.000 | 1 | 1 | 0 | 9.000 | 0.643 | 0.643 | 0.615 |
| TOTALS | 2 | 5.6 | 49 | 46 | 42 | 66 | 108 | 61.1% | 20 | 3.529 | 16 | 0 | 19 | 10 | 7 | 3 | 6 | 3 | 0 | 0 | 0.000 | 1 | 1 | 0 | 5.118 | 0.592 | 0.565 | 0.487 |
| FIELD | BF | K | ABB | RBB | IBB | SF | HR | non-HR H | Other |
|---|---|---|---|---|---|---|---|---|---|
| Havins 2 | 35 | 0.0% | 8.6% | 17.1% | 0.0% | 0.0% | 0.0% | 31.4% | 42.9% |
| Havins 4 | 14 | 0.0% | 0.0% | 7.1% | 0.0% | 0.0% | 7.1% | 50.0% | 35.7% |
| TOTALS | 49 | 0.0% | 6.1% | 14.3% | 0.0% | 0.0% | 2.0% | 36.7% | 40.8% |
| FIELD | Actual BF | K | RBB | IBB | SF | HR | non-HR H | Other |
|---|---|---|---|---|---|---|---|---|
| Havins 2 | 32 | 0.0% | 18.8% | 0.0% | 0.0% | 0.0% | 34.4% | 46.9% |
| Havins 4 | 14 | 0.0% | 7.1% | 0.0% | 0.0% | 7.1% | 50.0% | 35.7% |
| TOTALS | 46 | 0.0% | 15.2% | 0.0% | 0.0% | 2.2% | 39.1% | 43.5% |
| # | GAME | PA | Actual PA | AB | R | H | 1B | 2B | 3B | HR | IHR | OHR | RBI | BB | RBB | ABB | Kc | Ks | SO | SF | RPA | OBP | ROBP | SLG | OPS | ROPS | AVG | ROE | FC | CI | GDP | GTP | AB/RSP | H/RSP | BA/RSP |
|---|---|---|---|---|---|---|---|---|---|---|---|---|---|---|---|---|---|---|---|---|---|---|---|---|---|---|---|---|---|---|---|---|---|---|---|
| 53-3 | Spring II '10, Game 3 | 3 | 3 | 2 | 3 | 2 | 0 | 1 | 1 | 0 | 0 | 0 | 4 | 1 | 1 | 0 | 0 | 0 | 0 | 0 | 2.333 | 1.000 | 1.000 | 2.500 | 3.500 | 3.500 | 1.000 | 0 | 0 | 0 | 0 | 0 | 2 | 2 | 1.000 |
| 53-4 | Spring II '10, Game 4 | 3 | 2 | 2 | 3 | 2 | 1 | 0 | 1 | 0 | 0 | 0 | 2 | 1 | 0 | 1 | 0 | 0 | 0 | 0 | 1.667 | 1.000 | 1.000 | 2.000 | 3.000 | 3.000 | 1.000 | 0 | 0 | 0 | 0 | 0 | 0 | 0 | 0.000 |
| 53-5 | Spring II '10, Game 5 | 4 | 4 | 2 | 2 | 2 | 1 | 1 | 0 | 0 | 0 | 0 | 2 | 2 | 2 | 0 | 0 | 0 | 0 | 0 | 1.000 | 1.000 | 1.000 | 1.500 | 2.500 | 2.500 | 1.000 | 0 | 0 | 0 | 0 | 0 | 1 | 1 | 1.000 |
| 53-6 | Spring II '10, Game 6 | 3 | 2 | 2 | 0 | 0 | 0 | 0 | 0 | 0 | 0 | 0 | 1 | 1 | 0 | 1 | 0 | 0 | 0 | 0 | 0.333 | 0.333 | 0.000 | 0.000 | 0.333 | 0.000 | 0.000 | 0 | 0 | 0 | 0 | 0 | 2 | 0 | 0.000 |
| 53-7 | Spring II '10, Game 7 | 3 | 3 | 3 | 1 | 1 | 1 | 0 | 0 | 0 | 0 | 0 | 0 | 0 | 0 | 0 | 0 | 0 | 0 | 0 | 0.333 | 0.333 | 0.333 | 0.333 | 0.667 | 0.667 | 0.333 | 0 | 0 | 0 | 0 | 0 | 2 | 0 | 0.000 |
| 54-1 | Summer I '10, Game 1 | 4 | 4 | 4 | 1 | 3 | 3 | 0 | 0 | 0 | 0 | 0 | 3 | 0 | 0 | 0 | 0 | 0 | 0 | 0 | 1.000 | 0.750 | 0.750 | 0.750 | 1.500 | 1.500 | 0.750 | 0 | 0 | 0 | 0 | 0 | 3 | 3 | 1.000 |
| 54-6 | Summer I '10, Game 6 | 3 | 2 | 2 | 2 | 2 | 0 | 1 | 1 | 0 | 0 | 0 | 4 | 1 | 0 | 1 | 0 | 0 | 0 | 0 | 2.000 | 1.000 | 1.000 | 2.500 | 3.500 | 3.500 | 1.000 | 0 | 0 | 0 | 0 | 0 | 1 | 1 | 1.000 |
| 54-7 | Summer I '10, Game 7 | 4 | 2 | 2 | 1 | 1 | 1 | 0 | 0 | 0 | 0 | 0 | 1 | 2 | 0 | 2 | 0 | 0 | 0 | 0 | 0.500 | 0.750 | 0.500 | 0.500 | 1.250 | 1.000 | 0.500 | 0 | 0 | 0 | 0 | 0 | 1 | 0 | 0.000 |
| 54-8 | Summer I '10, Game 8 | 3 | 3 | 3 | 0 | 3 | 3 | 0 | 0 | 0 | 0 | 0 | 0 | 0 | 0 | 0 | 0 | 0 | 0 | 0 | 0.000 | 1.000 | 1.000 | 1.000 | 2.000 | 2.000 | 1.000 | 0 | 0 | 0 | 0 | 0 | 0 | 0 | 0.000 |
| 55-1 | Summer II '10, Game 1 | 3 | 3 | 3 | 0 | 0 | 0 | 0 | 0 | 0 | 0 | 0 | 0 | 0 | 0 | 0 | 0 | 0 | 0 | 0 | 0.000 | 0.000 | 0.000 | 0.000 | 0.000 | 0.000 | 0.000 | 0 | 1 | 0 | 0 | 0 | 1 | 0 | 0.000 |
| 55-2 | Summer II '10, Game 2 | 4 | 4 | 3 | 1 | 1 | 1 | 0 | 0 | 0 | 0 | 0 | 1 | 0 | 0 | 0 | 0 | 0 | 0 | 1 | 0.500 | 0.250 | 0.250 | 0.333 | 0.583 | 0.583 | 0.333 | 0 | 0 | 0 | 0 | 0 | 1 | 1 | 1.000 |
| 55-3 | Summer II '10, Game 3 | 3 | 2 | 2 | 2 | 0 | 0 | 0 | 0 | 0 | 0 | 0 | 2 | 1 | 0 | 1 | 0 | 0 | 0 | 0 | 1.333 | 0.333 | 0.000 | 0.000 | 0.333 | 0.000 | 0.000 | 1 | 0 | 0 | 0 | 0 | 1 | 0 | 0.000 |
| 55-4 | Summer II '10, Game 4 | 3 | 3 | 3 | 0 | 2 | 2 | 0 | 0 | 0 | 0 | 0 | 1 | 0 | 0 | 0 | 0 | 0 | 0 | 0 | 0.333 | 0.667 | 0.667 | 0.667 | 1.333 | 1.333 | 0.667 | 0 | 0 | 0 | 0 | 0 | 2 | 1 | 0.500 |
| 55-5 | Summer II '10, Game 5 | 4 | 4 | 4 | 1 | 2 | 2 | 0 | 0 | 0 | 0 | 0 | 2 | 0 | 0 | 0 | 0 | 0 | 0 | 0 | 0.750 | 0.500 | 0.500 | 0.500 | 1.000 | 1.000 | 0.500 | 0 | 0 | 0 | 0 | 0 | 3 | 2 | 0.667 |
| 55-6 | Summer II '10, Game 6 | 3 | 3 | 3 | 0 | 3 | 3 | 0 | 0 | 0 | 0 | 0 | 0 | 0 | 0 | 0 | 0 | 0 | 0 | 0 | 0.000 | 1.000 | 1.000 | 1.000 | 2.000 | 2.000 | 1.000 | 0 | 0 | 0 | 0 | 0 | 2 | 2 | 1.000 |
| 56-1 | Fall '10, Game 1 | 3 | 3 | 2 | 2 | 2 | 2 | 0 | 0 | 0 | 0 | 0 | 3 | 1 | 1 | 0 | 0 | 0 | 0 | 0 | 1.667 | 1.000 | 1.000 | 1.000 | 2.000 | 2.000 | 1.000 | 0 | 0 | 0 | 0 | 0 | 2 | 2 | 1.000 |
| 56-3 | Fall '10, Game 3 | 3 | 3 | 3 | 2 | 2 | 2 | 0 | 0 | 0 | 0 | 0 | 1 | 0 | 0 | 0 | 0 | 0 | 0 | 0 | 1.000 | 0.667 | 0.667 | 0.667 | 1.333 | 1.333 | 0.667 | 0 | 0 | 0 | 0 | 0 | 2 | 1 | 0.500 |
| 56-4 | Fall '10, Game 4 | 4 | 4 | 4 | 3 | 3 | 3 | 0 | 0 | 0 | 0 | 0 | 0 | 0 | 0 | 0 | 0 | 0 | 0 | 0 | 0.750 | 0.750 | 0.750 | 0.750 | 1.500 | 1.500 | 0.750 | 0 | 0 | 0 | 0 | 0 | 3 | 2 | 0.667 |
| 57-1 | Winter '10-'11, Game 1 | 3 | 2 | 2 | 1 | 0 | 0 | 0 | 0 | 0 | 0 | 0 | 0 | 1 | 0 | 1 | 0 | 0 | 0 | 0 | 0.333 | 0.333 | 0.000 | 0.000 | 0.333 | 0.000 | 0.000 | 0 | 0 | 0 | 0 | 0 | 0 | 0 | 0.000 |
| 57-2 | Winter '10-'11, Game 2 | 3 | 3 | 3 | 0 | 2 | 2 | 0 | 0 | 0 | 0 | 0 | 0 | 0 | 0 | 0 | 0 | 0 | 0 | 0 | 0.000 | 0.667 | 0.667 | 0.667 | 1.333 | 1.333 | 0.667 | 0 | 0 | 0 | 0 | 0 | 1 | 0 | 0.000 |
| 57-3 | Winter '10-'11, Game 3 | 3 | 3 | 3 | 3 | 2 | 1 | 0 | 1 | 0 | 0 | 0 | 2 | 0 | 0 | 0 | 0 | 0 | 0 | 0 | 1.667 | 0.667 | 0.667 | 1.333 | 2.000 | 2.000 | 0.667 | 0 | 1 | 0 | 0 | 0 | 1 | 1 | 1.000 |
| 57-4 | Winter '10-'11, Game 4 | 3 | 3 | 3 | 0 | 0 | 0 | 0 | 0 | 0 | 0 | 0 | 0 | 0 | 0 | 0 | 0 | 0 | 0 | 0 | 0.000 | 0.000 | 0.000 | 0.000 | 0.000 | 0.000 | 0.000 | 0 | 1 | 0 | 1 | 0 | 1 | 0 | 0.000 |
| 57-5 | Winter '10-'11, Game 5 | 3 | 3 | 3 | 1 | 1 | 1 | 0 | 0 | 0 | 0 | 0 | 0 | 0 | 0 | 0 | 0 | 0 | 0 | 0 | 0.333 | 0.333 | 0.333 | 0.333 | 0.667 | 0.667 | 0.333 | 0 | 0 | 0 | 0 | 0 | 2 | 1 | 0.500 |
| 57-6 | Winter '10-'11, Game 6 | 3 | 3 | 3 | 0 | 1 | 0 | 1 | 0 | 0 | 0 | 0 | 2 | 0 | 0 | 0 | 0 | 0 | 0 | 0 | 0.667 | 0.333 | 0.333 | 0.667 | 1.000 | 1.000 | 0.333 | 0 | 1 | 0 | 0 | 0 | 3 | 1 | 0.333 |
| 58-2 | Spring '11, Game 2 | 3 | 3 | 3 | 0 | 0 | 0 | 0 | 0 | 0 | 0 | 0 | 0 | 0 | 0 | 0 | 0 | 1 | 1 | 0 | 0.000 | 0.000 | 0.000 | 0.000 | 0.000 | 0.000 | 0.000 | 0 | 0 | 0 | 0 | 0 | 2 | 0 | 0.000 |
| 58-4 | Spring '11, Game 4 | 4 | 4 | 4 | 2 | 2 | 2 | 0 | 0 | 0 | 0 | 0 | 0 | 0 | 0 | 0 | 0 | 0 | 0 | 0 | 0.500 | 0.500 | 0.500 | 0.500 | 1.000 | 1.000 | 0.500 | 0 | 0 | 0 | 0 | 0 | 1 | 0 | 0.000 |
| 58-5 | Spring '11, Game 5 | 2 | 2 | 2 | 0 | 0 | 0 | 0 | 0 | 0 | 0 | 0 | 0 | 0 | 0 | 0 | 0 | 0 | 0 | 0 | 0.000 | 0.000 | 0.000 | 0.000 | 0.000 | 0.000 | 0.000 | 0 | 1 | 0 | 0 | 0 | 2 | 0 | 0.000 |
| 58-6 | Spring '11, Game 6 | 3 | 2 | 1 | 1 | 0 | 0 | 0 | 0 | 0 | 0 | 0 | 0 | 2 | 1 | 1 | 0 | 0 | 0 | 0 | 0.333 | 0.667 | 0.500 | 0.000 | 0.667 | 0.500 | 0.000 | 0 | 0 | 0 | 0 | 0 | 1 | 0 | 0.000 |
| 58-7 | Spring '11, Game 7 | 4 | 4 | 4 | 1 | 1 | 1 | 0 | 0 | 0 | 0 | 0 | 0 | 0 | 0 | 0 | 0 | 0 | 0 | 0 | 0.250 | 0.250 | 0.250 | 0.250 | 0.500 | 0.500 | 0.250 | 0 | 0 | 0 | 0 | 0 | 3 | 0 | 0.000 |
| 59-1 | Summer I '11, Game 1 | 3 | 3 | 2 | 1 | 2 | 2 | 0 | 0 | 0 | 0 | 0 | 2 | 0 | 0 | 0 | 0 | 0 | 0 | 1 | 1.000 | 0.667 | 0.667 | 1.000 | 1.667 | 1.667 | 1.000 | 0 | 0 | 0 | 0 | 0 | 1 | 1 | 1.000 |
| 60-1 | Summer II '11, Game 1 | 3 | 3 | 3 | 0 | 0 | 0 | 0 | 0 | 0 | 0 | 0 | 0 | 0 | 0 | 0 | 0 | 0 | 0 | 0 | 0.000 | 0.000 | 0.000 | 0.000 | 0.000 | 0.000 | 0.000 | 0 | 1 | 0 | 0 | 0 | 0 | 0 | 0.000 |
| 60-2 | Summer II '11, Game 2 | 4 | 4 | 4 | 1 | 2 | 2 | 0 | 0 | 0 | 0 | 0 | 1 | 0 | 0 | 0 | 0 | 0 | 0 | 0 | 0.500 | 0.500 | 0.500 | 0.500 | 1.000 | 1.000 | 0.500 | 0 | 1 | 0 | 0 | 0 | 3 | 1 | 0.333 |
| 60-3 | Summer II '11, Game 3 | 4 | 4 | 4 | 0 | 2 | 1 | 0 | 1 | 0 | 0 | 0 | 1 | 0 | 0 | 0 | 0 | 0 | 0 | 0 | 0.250 | 0.500 | 0.500 | 1.000 | 1.500 | 1.500 | 0.500 | 0 | 1 | 0 | 0 | 0 | 3 | 1 | 0.333 |
| 60-4 | Summer II '11, Game 4 | 3 | 3 | 3 | 0 | 0 | 0 | 0 | 0 | 0 | 0 | 0 | 0 | 0 | 0 | 0 | 0 | 0 | 0 | 0 | 0.000 | 0.000 | 0.000 | 0.000 | 0.000 | 0.000 | 0.000 | 0 | 0 | 0 | 0 | 0 | 1 | 0 | 0.000 |
| 60-6 | Summer II '11, Game 6 | 3 | 3 | 3 | 1 | 1 | 1 | 0 | 0 | 0 | 0 | 0 | 2 | 0 | 0 | 0 | 0 | 0 | 0 | 0 | 1.000 | 0.333 | 0.333 | 0.333 | 0.667 | 0.667 | 0.333 | 0 | 1 | 0 | 0 | 0 | 3 | 1 | 0.333 |
| 60-7 | Summer II '11, Game 7 | 4 | 3 | 3 | 1 | 1 | 1 | 0 | 0 | 0 | 0 | 0 | 2 | 1 | 0 | 1 | 0 | 0 | 0 | 0 | 0.750 | 0.500 | 0.333 | 0.333 | 0.833 | 0.667 | 0.333 | 0 | 0 | 0 | 0 | 0 | 2 | 1 | 0.500 |
| 61-1 | Fall '11, Game 1 | 3 | 3 | 3 | 0 | 2 | 2 | 0 | 0 | 0 | 0 | 0 | 0 | 0 | 0 | 0 | 0 | 0 | 0 | 0 | 0.000 | 0.667 | 0.667 | 0.667 | 1.333 | 1.333 | 0.667 | 0 | 0 | 0 | 0 | 0 | 3 | 2 | 0.667 |
| 61-3 | Fall '11, Game 3 | 3 | 2 | 1 | 2 | 0 | 0 | 0 | 0 | 0 | 0 | 0 | 0 | 2 | 1 | 1 | 0 | 0 | 0 | 0 | 0.667 | 0.667 | 0.500 | 0.000 | 0.667 | 0.500 | 0.000 | 1 | 0 | 0 | 0 | 0 | 1 | 0 | 0.000 |
| 61-4 | Fall '11, Game 4 | 3 | 3 | 3 | 1 | 1 | 1 | 0 | 0 | 0 | 0 | 0 | 0 | 0 | 0 | 0 | 0 | 0 | 0 | 0 | 0.333 | 0.333 | 0.333 | 0.333 | 0.667 | 0.667 | 0.333 | 0 | 0 | 0 | 0 | 0 | 1 | 1 | 1.000 |
| 61-6 | Fall '11, Game 6 | 5 | 5 | 4 | 2 | 1 | 0 | 1 | 0 | 0 | 0 | 0 | 1 | 1 | 1 | 0 | 0 | 0 | 0 | 0 | 0.600 | 0.400 | 0.400 | 0.500 | 0.900 | 0.900 | 0.250 | 1 | 0 | 0 | 0 | 0 | 2 | 1 | 0.500 |
| 62-1 | Winter '12, Game 1 | 3 | 2 | 2 | 1 | 1 | 1 | 0 | 0 | 0 | 0 | 0 | 1 | 1 | 0 | 1 | 0 | 0 | 0 | 0 | 0.667 | 0.667 | 0.500 | 0.500 | 1.167 | 1.000 | 0.500 | 0 | 0 | 0 | 0 | 0 | 1 | 1 | 1.000 |
| 62-2 | Winter '12, Game 2 | 3 | 3 | 3 | 3 | 3 | 1 | 1 | 1 | 0 | 0 | 0 | 3 | 0 | 0 | 0 | 0 | 0 | 0 | 0 | 2.000 | 1.000 | 1.000 | 2.000 | 3.000 | 3.000 | 1.000 | 0 | 0 | 0 | 0 | 0 | 3 | 3 | 1.000 |
| 62-3 | Winter '12, Game 3 | 3 | 3 | 3 | 1 | 2 | 2 | 0 | 0 | 0 | 0 | 0 | 1 | 0 | 0 | 0 | 0 | 0 | 0 | 0 | 0.667 | 0.667 | 0.667 | 0.667 | 1.333 | 1.333 | 0.667 | 0 | 0 | 0 | 0 | 0 | 1 | 1 | 1.000 |
| 62-4 | Winter '12, Game 4 | 3 | 3 | 2 | 2 | 2 | 1 | 1 | 0 | 0 | 0 | 0 | 1 | 1 | 1 | 0 | 0 | 0 | 0 | 0 | 1.000 | 1.000 | 1.000 | 1.500 | 2.500 | 2.500 | 1.000 | 0 | 0 | 0 | 0 | 0 | 2 | 2 | 1.000 |
| 62-5 | Winter '12, Game 5 | 4 | 4 | 4 | 2 | 2 | 2 | 0 | 0 | 0 | 0 | 0 | 0 | 0 | 0 | 0 | 0 | 0 | 0 | 0 | 0.500 | 0.500 | 0.500 | 0.500 | 1.000 | 1.000 | 0.500 | 0 | 0 | 0 | 0 | 0 | 2 | 1 | 0.500 |
| 63-1 | Spring '12, Game 1 | 4 | 4 | 3 | 2 | 2 | 2 | 0 | 0 | 0 | 0 | 0 | 2 | 0 | 0 | 0 | 0 | 0 | 0 | 1 | 1.000 | 0.500 | 0.500 | 0.667 | 1.167 | 1.167 | 0.667 | 0 | 1 | 0 | 0 | 0 | 3 | 2 | 0.667 |
| 63-3 | Spring '12, Game 3 | 3 | 3 | 3 | 0 | 0 | 0 | 0 | 0 | 0 | 0 | 0 | 0 | 0 | 0 | 0 | 0 | 0 | 0 | 0 | 0.000 | 0.000 | 0.000 | 0.000 | 0.000 | 0.000 | 0.000 | 0 | 0 | 0 | 0 | 0 | 2 | 0 | 0.000 |
| 63-4 | Spring '12, Game 4 | 4 | 3 | 3 | 0 | 1 | 1 | 0 | 0 | 0 | 0 | 0 | 2 | 1 | 0 | 1 | 0 | 0 | 0 | 0 | 0.500 | 0.500 | 0.333 | 0.333 | 0.833 | 0.667 | 0.333 | 0 | 0 | 0 | 0 | 0 | 3 | 1 | 0.333 |
| 63-5 | Spring '12, Game 5 | 4 | 4 | 4 | 1 | 2 | 1 | 1 | 0 | 0 | 0 | 0 | 1 | 0 | 0 | 0 | 0 | 0 | 0 | 0 | 0.500 | 0.500 | 0.500 | 0.750 | 1.250 | 1.250 | 0.500 | 0 | 0 | 0 | 0 | 0 | 2 | 0 | 0.000 |
| 63-8 | Spring '12, Game 8 | 3 | 1 | 1 | 1 | 0 | 0 | 0 | 0 | 0 | 0 | 0 | 1 | 2 | 0 | 2 | 0 | 0 | 0 | 0 | 0.667 | 0.667 | 0.000 | 0.000 | 0.667 | 0.000 | 0.000 | 0 | 0 | 0 | 0 | 0 | 1 | 0 | 0.000 |
| 63-9 | Spring '12, Game 9 | 4 | 4 | 4 | 1 | 1 | 1 | 0 | 0 | 0 | 0 | 0 | 1 | 0 | 0 | 0 | 0 | 0 | 0 | 0 | 0.500 | 0.250 | 0.250 | 0.250 | 0.500 | 0.500 | 0.250 | 0 | 0 | 0 | 0 | 0 | 3 | 0 | 0.000 |
| 64-1 | Summer '12, Game 1 | 4 | 4 | 4 | 2 | 3 | 3 | 0 | 0 | 0 | 0 | 0 | 3 | 0 | 0 | 0 | 0 | 0 | 0 | 0 | 1.250 | 0.750 | 0.750 | 0.750 | 1.500 | 1.500 | 0.750 | 0 | 0 | 0 | 0 | 0 | 3 | 3 | 1.000 |
| 65-6 | Fall '12, Game 6 | 3 | 2 | 2 | 1 | 2 | 2 | 0 | 0 | 0 | 0 | 0 | 2 | 1 | 0 | 1 | 0 | 0 | 0 | 0 | 1.000 | 1.000 | 1.000 | 1.000 | 2.000 | 2.000 | 1.000 | 0 | 0 | 0 | 0 | 0 | 2 | 2 | 1.000 |
| 65-7 | Fall '12, Game 7 | 3 | 3 | 3 | 1 | 1 | 0 | 0 | 1 | 0 | 0 | 0 | 3 | 0 | 0 | 0 | 0 | 0 | 0 | 0 | 1.333 | 0.333 | 0.333 | 1.000 | 1.333 | 1.333 | 0.333 | 0 | 0 | 0 | 0 | 0 | 2 | 1 | 0.500 |
| 66-8 | Winter '12-'13, Game 8 | 4 | 3 | 3 | 2 | 3 | 2 | 1 | 0 | 0 | 0 | 0 | 3 | 1 | 0 | 1 | 0 | 0 | 0 | 0 | 1.250 | 1.000 | 1.000 | 1.333 | 2.333 | 2.333 | 1.000 | 0 | 0 | 0 | 0 | 0 | 1 | 1 | 1.000 |
| 70-3 | Fall '13, Game 3 | 2 | 2 | 1 | 1 | 0 | 0 | 0 | 0 | 0 | 0 | 0 | 1 | 1 | 1 | 0 | 0 | 0 | 0 | 0 | 1.000 | 0.500 | 0.500 | 0.000 | 0.500 | 0.500 | 0.000 | 1 | 0 | 0 | 0 | 0 | 1 | 0 | 0.000 |
| 74-3 | Summer II '14, Game 3 | 1 | 1 | 1 | 0 | 0 | 0 | 0 | 0 | 0 | 0 | 0 | 0 | 0 | 0 | 0 | 0 | 0 | 0 | 0 | 0.000 | 0.000 | 0.000 | 0.000 | 0.000 | 0.000 | 0.000 | 0 | 0 | 0 | 0 | 0 | 0 | 0 | 0.000 |
| TOTALS | 187 | 171 | 159 | 63 | 77 | 61 | 9 | 7 | 0 | 0 | 0 | 65 | 25 | 9 | 16 | 0 | 1 | 1 | 3 | 0.684 | 0.545 | 0.503 | 0.629 | 1.174 | 1.132 | 0.484 | 4 | 10 | 0 | 1 | 0 | 98 | 48 | 0.490 |
| # | GAME | IP | BF | Actual BF | Balls | Strikes | PIT | Strike% | R | RA | ER | K | H | BB | RBB | ABB | FBB | MBB | IBB | SF | K/BB | HR | IHR | OHR | WHIP | OBP | ROBP | BAA |
|---|---|---|---|---|---|---|---|---|---|---|---|---|---|---|---|---|---|---|---|---|---|---|---|---|---|---|---|---|
| 55-1 | Summer II '10, Game 1 | 4.6 | 35 | 32 | 34 | 47 | 81 | 58.0% | 10 | 2.143 | 10 | 0 | 11 | 9 | 6 | 3 | 5 | 3 | 0 | 0 | 0.000 | 0 | 0 | 0 | 4.286 | 0.571 | 0.531 | 0.423 |
| 59-1 | Summer I '11, Game 1 | 1.0 | 14 | 14 | 8 | 19 | 27 | 70.4% | 10 | 10.000 | 6 | 0 | 8 | 1 | 1 | 0 | 1 | 0 | 0 | 0 | 0.000 | 1 | 1 | 0 | 9.000 | 0.643 | 0.643 | 0.615 |
| TOTALS | 5.6 | 49 | 46 | 42 | 66 | 108 | 61.1% | 20 | 3.529 | 16 | 0 | 19 | 10 | 7 | 3 | 6 | 3 | 0 | 0 | 0.000 | 1 | 1 | 0 | 5.118 | 0.592 | 0.565 | 0.487 |
The following is a table of where this player falls within various statistical rankings. The first column (Category) is the name of the statistic. The second column (Value) is the value of that statistic for this player. The third column (Rank) is where this player ranks among all Ice Weasels for the given statistic. The fourth column (Distance To Top) is the number of Ice Weasels who have a better ranking than this player. The fifth column (Number Tied) is the number of players who have an identical ranking. The sixth column (Distance To Bottom) is the number of players who have a lesser rating. The final column (Number Unranked) is the number of Ice Weasels who have no ranking for this category (i.e. they do not qualify)
| Category | Value | Rank | Distance To Top | Number Tied | Distance To Bottom | Number Unranked |
|---|---|---|---|---|---|---|
| Game Appearances | 59 | 28th | 28 | 0 | 332 | 0 |
| Attendance (min 10 games) | 38.06% (59 of 155 possible games) | 55th | 59 | 0 | 31 | 270 |
| Consecutive Game Streak | 10 | 25th | 44 | 4 | 312 | 0 |
| Seasons Played | 17 | 19th | 24 | 2 | 334 | 0 |
| Win Percent (min 10 games) | 69.49% | 14th | 14 | 0 | 76 | 270 |
| Wins | 41 | 25th | 26 | 0 | 334 | 0 |
| Losses | 18 | 31st | 41 | 0 | 319 | 0 |
| Personal Consecutive Win Streak | 12 | 7th | 12 | 4 | 344 | 0 |
| P | C | 1B | 2B | 3B | SS | LF | LCF | RCF | RF | CF | SF | DH |
|---|---|---|---|---|---|---|---|---|---|---|---|---|
| 2 | 2 | 0 | 0 | 0 | 0 | 39 | 11 | 0 | 39 | 0 | 0 | 38 |
| Summer II '10 | Summer I '11 |
|---|---|
| Game 1, P | Game 1, LF/P |
| Category | Value | Rank | Distance To Top | Number Tied | Distance To Bottom | Number Unranked |
|---|---|---|---|---|---|---|
| Appearances | 2 | 17th | 20 | 3 | 337 | 0 |
| Wins | 1 | 14th | 20 | 5 | 335 | 0 |
| Losses | 1 | 12th | 18 | 11 | 331 | 0 |
| Fall '11 | Fall '12 |
|---|---|
| Game 3, LF/C | Game 6, RF/LCF/C |
| Category | Value | Rank | Distance To Top | Number Tied | Distance To Bottom | Number Unranked |
|---|---|---|---|---|---|---|
| Appearances | 2 | 31st | 54 | 25 | 281 | 0 |
| Wins | 2 | 23rd | 38 | 16 | 306 | 0 |
| Losses | 0 | 27th | 98 | 262 | 0 | 0 |
| Spring II '10 | Summer I '10 | Summer II '10 | Fall '10 | Winter '10-'11 |
|---|---|---|---|---|
|
Game 2, LF Game 5, LF/RF |
Game 1, LF Game 6, RF/LF/DH Game 7, RF/LF/DH Game 8, LF |
Game 2, LF Game 3, RF/DH/LF Game 4, RF/DH/LF Game 5, RF/DH/LF Game 6, RF/LF/DH |
Game 1, RF/DH/LF Game 3, LF/DH Game 4, LF/DH |
Game 1, DH/RF/LF Game 2, LF/RF/DH Game 3, LF/DH Game 4, LF/DH Game 5, RF/DH/LF Game 6, RF/DH/LF |
| Spring '11 | Summer I '11 | Summer II '11 | Fall '11 | Winter '12 |
|
Game 2, LF Game 4, LF Game 5, RF/LF Game 6, RF/DH/LF Game 7, LF |
Game 1, LF/P |
Game 2, RF/LF/DH Game 3, LF Game 4, RF/LF/DH Game 6, DH/RF/LF Game 7, LF |
Game 3, LF/C Game 4, RF/DH/LF Game 6, RF/LF |
Game 1, RF/DH/LF Game 2, LF/DH Game 3, RF/LF/DH Game 4, LF/RF/DH |
| Fall '13 | ||||
| Game 3, LF/DH/RF |
| Category | Value | Rank | Distance To Top | Number Tied | Distance To Bottom | Number Unranked |
|---|---|---|---|---|---|---|
| Appearances | 39 | 6th | 6 | 0 | 354 | 0 |
| Wins | 24 | 6th | 5 | 1 | 354 | 0 |
| Losses | 15 | 7th | 8 | 0 | 352 | 0 |
| Win Percent at LF (min 10 games) | 61.53% | 5th | 4 | 1 | 13 | 342 |
| Winter '12 | Spring '12 | Summer '12 | Fall '12 | Winter '12-'13 |
|---|---|---|---|---|
| Game 5, LCF/DH |
Game 3, LCF/DH/RF Game 4, RF/LCF Game 5, LCF/DH Game 8, RF/DH/LCF Game 9, LCF/DH |
Game 1, RF/DH/LCF |
Game 6, RF/LCF/C Game 7, RF/DH/LCF |
Game 8, RF/DH/LCF |
| Summer II '14 | ||||
| Game 3, RF/DH/LCF |
| Category | Value | Rank | Distance To Top | Number Tied | Distance To Bottom | Number Unranked |
|---|---|---|---|---|---|---|
| Appearances | 11 | 17th | 18 | 1 | 341 | 0 |
| Wins | 10 | 14th | 13 | 1 | 346 | 0 |
| Losses | 1 | 18th | 37 | 35 | 288 | 0 |
| Win Percent at LCF (min 10 games) | 90.90% | 1st | 0 | 0 | 22 | 338 |
| Winter '09-'10 | Spring II '10 | Summer I '10 | Summer II '10 | Fall '10 |
|---|---|---|---|---|
| Game 5, RF |
Game 3, RF/DH Game 4, RF/DH Game 5, LF/RF Game 6, RF Game 7, RF/DH |
Game 6, RF/LF/DH Game 7, RF/LF/DH |
Game 3, RF/DH/LF Game 4, RF/DH/LF Game 5, RF/DH/LF Game 6, RF/LF/DH |
Game 1, RF/DH/LF |
| Winter '10-'11 | Spring '11 | Summer II '11 | Fall '11 | Winter '12 |
|
Game 1, DH/RF/LF Game 2, LF/RF/DH Game 5, RF/DH/LF Game 6, RF/DH/LF |
Game 5, RF/LF Game 6, RF/DH/LF |
Game 1, DH/RF Game 2, RF/LF/DH Game 4, RF/LF/DH Game 6, DH/RF/LF |
Game 1, RF Game 4, RF/DH/LF Game 6, RF/LF |
Game 1, RF/DH/LF Game 3, RF/LF/DH Game 4, LF/RF/DH |
| Spring '12 | Summer '12 | Fall '12 | Winter '12-'13 | Fall '13 |
|
Game 1, RF Game 3, LCF/DH/RF Game 4, RF/LCF Game 8, RF/DH/LCF |
Game 1, RF/DH/LCF |
Game 6, RF/LCF/C Game 7, RF/DH/LCF |
Game 8, RF/DH/LCF | Game 3, LF/DH/RF |
| Summer II '14 | ||||
| Game 3, RF/DH/LCF |
| Category | Value | Rank | Distance To Top | Number Tied | Distance To Bottom | Number Unranked |
|---|---|---|---|---|---|---|
| Appearances | 39 | 6th | 5 | 0 | 355 | 0 |
| Wins | 27 | 6th | 5 | 0 | 355 | 0 |
| Losses | 12 | 7th | 7 | 0 | 353 | 0 |
| Win Percent at RF (min 10 games) | 69.23% | 4th | 4 | 0 | 15 | 341 |
| Spring II '10 | Summer I '10 | Summer II '10 | Fall '10 | Winter '10-'11 |
|---|---|---|---|---|
|
Game 3, RF/DH Game 4, RF/DH Game 7, RF/DH |
Game 6, RF/LF/DH Game 7, RF/LF/DH |
Game 3, RF/DH/LF Game 4, RF/DH/LF Game 5, RF/DH/LF Game 6, RF/LF/DH |
Game 1, RF/DH/LF Game 3, LF/DH Game 4, LF/DH |
Game 1, DH/RF/LF Game 2, LF/RF/DH Game 3, LF/DH Game 4, LF/DH Game 5, RF/DH/LF Game 6, RF/DH/LF |
| Spring '11 | Summer II '11 | Fall '11 | Winter '12 | Spring '12 |
| Game 6, RF/DH/LF |
Game 1, DH/RF Game 2, RF/LF/DH Game 4, RF/LF/DH Game 6, DH/RF/LF |
Game 4, RF/DH/LF |
Game 1, RF/DH/LF Game 2, LF/DH Game 3, RF/LF/DH Game 4, LF/RF/DH Game 5, LCF/DH |
Game 3, LCF/DH/RF Game 5, LCF/DH Game 8, RF/DH/LCF Game 9, LCF/DH |
| Summer '12 | Fall '12 | Winter '12-'13 | Fall '13 | Summer II '14 |
| Game 1, RF/DH/LCF | Game 7, RF/DH/LCF | Game 8, RF/DH/LCF | Game 3, LF/DH/RF | Game 3, RF/DH/LCF |
| Category | Value | Rank | Distance To Top | Number Tied | Distance To Bottom | Number Unranked |
|---|---|---|---|---|---|---|
| Appearances | 38 | 10th | 10 | 1 | 349 | 0 |
| Wins | 27 | 10th | 10 | 0 | 350 | 0 |
| Losses | 11 | 16th | 19 | 2 | 339 | 0 |
| Win Percent at DH (min 10 games) | 71.05% | 10th | 9 | 0 | 29 | 322 |
| Link | Size | Photographer | Description |
|---|---|---|---|
| jpg | 231K | Rob | Lindsay H puts on her game face during pregame warmups. |
| jpg | 626K | Rob | A pregame team photo. Crouching in the front, left to right, are Lacey and Mitch. The others, from left to right, are Becky, Matt, Lindsay H, Shawn W, Neil, Patrick O, Justin A, Amanda C, and Courtney. |
| jpg | 640K | Rob | Another pregame team photo. Crouching in the front, left to right, are Lacey and Mitch. The others, from left to right, are Becky, Matt, Lindsay H, Shawn W, Neil, Patrick O, Justin A, Amanda C, and Courtney. |
| jpg | 640K | Rob | And another pregame team photo. Crouching in the front, left to right, are Lacey and Mitch. The others, from left to right, are Becky, Matt, Lindsay H, Shawn W, Neil, Patrick O, Justin A, Amanda C, and Courtney. |
| jpg | 630K | Rob | Yet another pregame team photo. Crouching in the front, left to right, are Lacey and Mitch. The others, from left to right, are Becky, Matt, Lindsay H, Shawn W, Neil, Patrick O, Justin A, Amanda C, and Courtney. |
| jpg | 669K | Rob | A final pregame team photo. Crouching in the front, left to right, are Lacey and Mitch. The others, from left to right, are Becky, Matt, Lindsay H, Shawn W, Neil, Patrick O, Justin A, Amanda C, and Courtney. |
| jpg | 207K | Rob | Lindsay H at bat. |
| jpg | 171K | Rob | Lindsay H at first base. Matt is first base coach. |
| jpg | 478K | Rob | Lindsay H runs toward third base with a concerned look on her face. |
| jpg | 94K | Rob | Lindsay H throws a ball in from left field. Shawn W is visible in the background, having backed her up on the play. |
| jpg | 166K | Rob | Lindsay H at bat. |
| jpg | 355K | Rob | Lindsay H runs toward third base. |
| jpg | 101K | Rob | Lindsay H stands on second base. |
| jpg | 112K | Rob | Lindsay H nears third base and begins to dive. |
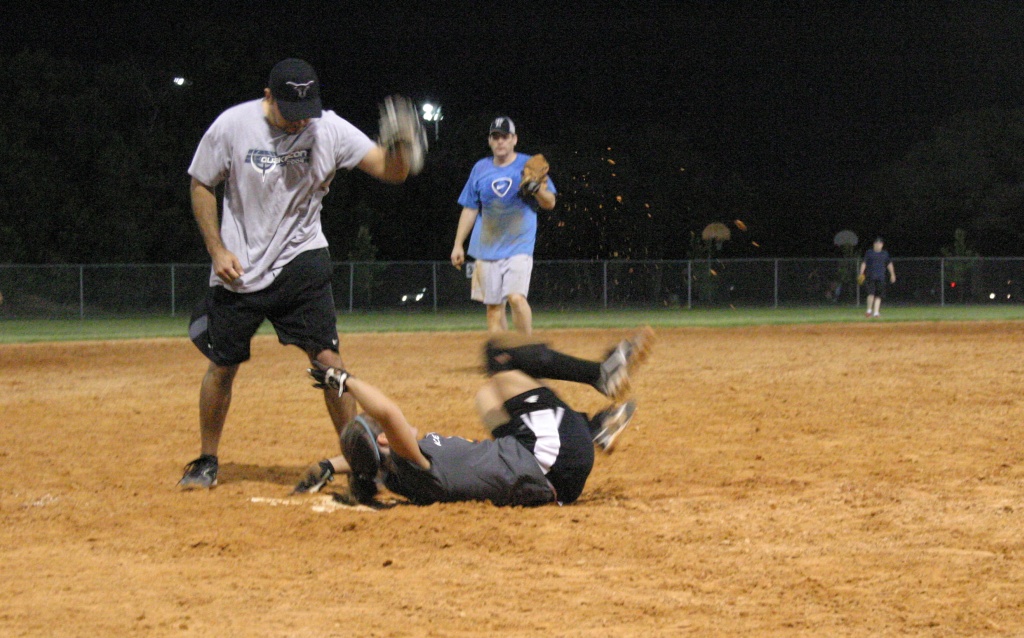
| jpg | 256K | Rob | Lindsay H continues her tumble/dive, reaching her hand toward third base as the third baseman reaches for the throw. |
| jpg | 271K | Rob | Lindsay H is on her back, with her head and hand on third base, as the third baseman looks down at her with the ball. |
| Link | Size | Photographer | Description |
|---|---|---|---|
| jpg | 707K | Rob | Team photo before the game. From left to right we have David M, Lacey (light grey non-Weasels shirt), Shawn W (behind Lacey), Patrick O, Lindsay H, Newton, Carrie Z, Matt, Becky, Neil, Mitch, Courtney, Amanda C (obscured by Courtney), Justin A, Teri, and Ted C. |
| jpg | 723K | Rob | Another team photo before the game. Left to right are David M, Lacey, Shawn W, Lindsay H, Patrick O, Carrie Z, Newton, Matt, Becky, Neil, Mitch, Courtney, Amanda C, Justin A, Teri, and Ted C. |
| jpg | 799K | Rob | Still another team photo before the game. Left to right are David M, Lacey, Shawn W, Lindsay H, Patrick O, Carrie Z, Newton, Matt, Becky, Neil, Mitch, Courtney, Amanda C, Justin A, Teri, and Ted C. |
| jpg | 739K | Rob | A final team photo before the game. Left to right are David M, Lacey, Shawn W, Lindsay H, Patrick O, Carrie Z, Newton, Matt, Becky, Neil, Mitch, Amanda C, Courtney, Justin A, Teri, and Ted C. |
| Link | Size | Photographer | Description |
|---|---|---|---|
| jpg | 304K | Courtney | Lindsay H stands at first base |
| jpg | 230K | Courtney | Lindsay H at bat. |
| Link | Size | Photographer | Description |
|---|---|---|---|
| jpg | 591K | Allen Pittman | Lindsay H crosses the plate in the top of the 2nd inning. Kelly B is on deck and Tim R is third base coach. In the dugout, from left to right, are Shawn W (white shirt, sitting), Mitch (in the door keeping score), Azzy (standing), and Lacey (black shirt, standing). Neil is barely visible standing behind the dugout. |
| jpg | 797K | Allen Pittman | Lindsay H at bat in the top of the 4th inning, looking back at the umpire. |
| jpg | 617K | Allen Pittman | Lindsay H still at bat in the top of the 4th inning, but no longer looking at the umpire . |
| jpg | 669K | Allen Pittman | Lindsay H STILL at bat in the top of the 4th inning, now looking back at the umpire and the catcher (who appear to be having a moment). |
| Link | Size | Photographer | Description |
|---|---|---|---|
| jpg | 692K | Rob | From left to right, Mitch, Patrick O, and Amanda C throw during pregame warmups. Lindsay H is visible in the background by the bleachers. |
| jpg | 118K | Rob | Shawn W swings the bat. Lindsay H is partially visible in the foreground, on deck. |
| Link | Size | Photographer | Description |
|---|---|---|---|
| jpg | 837K | Allen Pittman | Becky hits a ball in the top of the 2nd inning. Neil is on deck, Matt is the third base coach, and Mitch is standing in the door of the dugout keeping score. In the dugout, from left to right, are Tim R, Michelle F, Newton, Azzy, Lindsay H, and Kelly B. On the other side of Mitch in the dugout, Lacey is sitting on the bench. |
| jpg | 906K | Allen Pittman | Becky at the plate in the top of the 2nd inning, looking back at the catcher and/or umpire. Neil is on deck. In the dugout from left to right are Lacey (sitting), Mitch (keeping score in the dugout door), Michelle F (sitting), Kelly B (walking toward the dugout door), Newton, Azzy, and Lindsay H (yellow socks). |
| jpg | 578K | Allen Pittman | Becky has hit a ball in the top of the 2nd inning. Neil is on deck and Matt is third base coach. From left to right in the dugout you can see Lacey (sitting), Mitch (in the dugout door), Michelle F (sitting, partially obscured by Becky's head), Lindsay H (sitting), Newton, Azzy, and Kelly B. Outside of the field near the light post you can see Tim R. |
| jpg | 1135K | Allen Pittman | Lacey hits a ball in the top of the 2nd inning. Newton is on deck. In the dugout from left to right are Tim R (barely visible sitting on the becnh between the bat rack and the door), Mitch (in the doorway with red cleats), Shawn W (in the doorway with white shirt), Becky (barely visible behind Lacey's head), Lindsay H (sitting with yellow socks), Azzy, and Kelly B. |
| jpg | 692K | Allen Pittman | Neil crossing the plate in the top of the 2nd inning. Lindsay H is visible behind him walking toward the plate. Mitch is visible in the door of the dugout keeping score. Tim R is the third base coach. Within the dugout, from left to right, are Becky (sitting behing Mitch, only legs visible), Michelle F (sitting), and Azzy (standing). |